HOT TOPICS LIST
- Strategies
- Stocks
- Buy
- Investing
- Brokers
- Psychology
- Interviews
- Accumulate
- Sell
- Hold
- Spotlight
- Websites
- Candlestick Corner
- Gold & Metals
- Options Trading
LIST OF TOPICS
TRADER'S NOTEBOOK
Rising Interest Rates, Inflation, And Stocks
06/26/09 03:23:18 PM PSTby Michael Carr, CMT
What’s the buzz about inflation and interest rates?
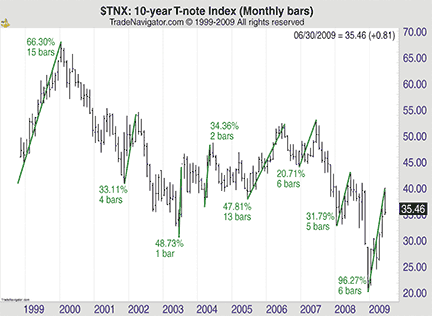
| The yield on the 10-year Treasury note has risen sharply since the beginning of the year. Researching those times when similar increases occurred can offer clues about the future of the economy, and from that, we can learn how the conventional wisdom on Wall Street can be wrong. PAST DATA
FIGURE 1: Over the last 10 years, long-term interest rates have repeatedly moved sharply higher and lower. |
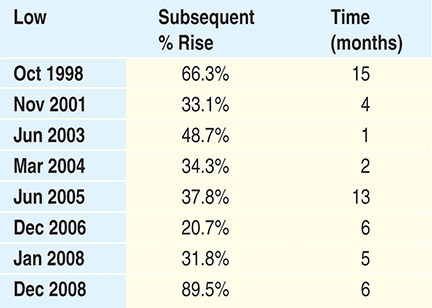
| The current move in interest rates is sharper than any other in the last decade. Figure 2 shows the level of volatility seen in yields; bond prices move inversely to yields and are less volatile. The actual 10-year note has only fallen in price by about 8% over the past six months. Nevertheless, there is much more volatility in fixed-income investing than many realize.
|
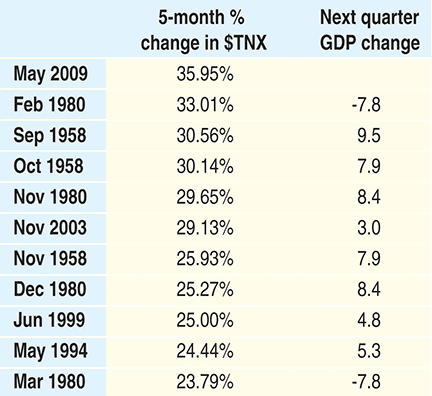
| After observing a short-term anomaly such as this change in the interest rate, it is useful to examine a longer time period. The Federal Reserve provides data on the $TNX going back to April 1953. Their data is for the end of the month only, so the ultimate low to high changes are not directly observable. Using this source, we find that the 10-year T-note interest rate is up 36% over the past five months, through the most recent data as of the end of May. From this more extensive data series, we can identify that the current rate environment is the sharpest five-month increase among the 670 available observations. This offers a starting point to study changes in the economy and the stock market after other sharp increases in interest rates. Figure 3 offers insight into economic growth after the sharp rise in rates. The median change in GDP in the quarter following the previous nine greatest increases in interest rates was 6.6%. Compare this with a median GDP change of zero percent over the entire time frame. Conventional wisdom is that higher interest rates can choke off economic activity. The data shows the opposite is true; sharply higher rates are actually an indicator of greater than normal economic gains.
|
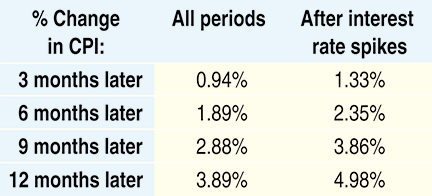
| Conventional wisdom also tells us that bond rates rise in response to inflationary pressures. The limited sample of big gainers in interest rates shows that inflation fears are not the primary drivers of interest rates. In Figure 4, we see that inflation, on average, is only slightly higher than normal after steep drops in bond prices.
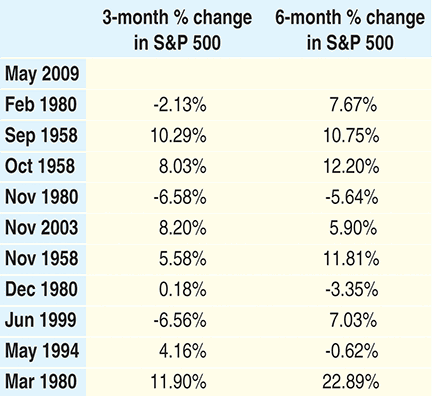
Stocks are said to be inversely correlated with interest rates; as rates go higher, bonds become more attractive relative to stocks, and therefore, stock prices would be expected to decline. On average, however, the data does not support this. The three-month average gain in the Standard & Poor’s 500 after the previous nine interest rate spikes was 3.31%. This compares with an average gain of 1.89% in all three-month periods. After an interest rate rise of this magnitude, stocks averaged a gain of 6.86% in the next six months. The average gain over all six-month periods was 3.87% from April 1953 through May 2009. Figure 5 provides the detailed history.
|
| LOOKING AHEAD Using the past as a guide, the economy is likely to see a dramatic change in the third quarter. While analysts are looking for a small decline in GDP, the consensus estimate seems to be around 0.2%. History shows that GDP is most likely to come in higher than expected. Inflation fears will probably remain more of a concern than actual inflation, and the stock market could deliver greater than average gains for the rest of the year. |
Mike Carr is a member of the Market Technicians Association and editor of the MTA's newsletter, Technically Speaking. He is a full-time trader and writer.
| E-mail address: | mcarr@dunnwarren.com |
PRINT THIS ARTICLE

|

Request Information From Our Sponsors
- StockCharts.com, Inc.
- Candle Patterns
- Candlestick Charting Explained
- Intermarket Technical Analysis
- John Murphy on Chart Analysis
- John Murphy's Chart Pattern Recognition
- John Murphy's Market Message
- MurphyExplainsMarketAnalysis-Intermarket Analysis
- MurphyExplainsMarketAnalysis-Visual Analysis
- StockCharts.com
- Technical Analysis of the Financial Markets
- The Visual Investor
- VectorVest, Inc.
- Executive Premier Workshop
- One-Day Options Course
- OptionsPro
- Retirement Income Workshop
- Sure-Fire Trading Systems (VectorVest, Inc.)
- Trading as a Business Workshop
- VectorVest 7 EOD
- VectorVest 7 RealTime/IntraDay
- VectorVest AutoTester
- VectorVest Educational Services
- VectorVest OnLine
- VectorVest Options Analyzer
- VectorVest ProGraphics v6.0
- VectorVest ProTrader 7
- VectorVest RealTime Derby Tool
- VectorVest Simulator
- VectorVest Variator
- VectorVest Watchdog

