

HOT TOPICS LIST
- Strategies
- Stocks
- Buy
- Investing
- Brokers
- Psychology
- Interviews
- Accumulate
- Sell
- Hold
- Spotlight
- Websites
- Candlestick Corner
- Gold & Metals
- Options Trading
LIST OF TOPICS
CANDLESTICK CORNER
Candlesticks For The Wise
09/29/08 12:42:02 PM PSTby Chaitali Mohile
The engulfing formation, three black crows, and three white advancing soldiers, along with few more candlestick patterns can make trading more interesting and more profitable.
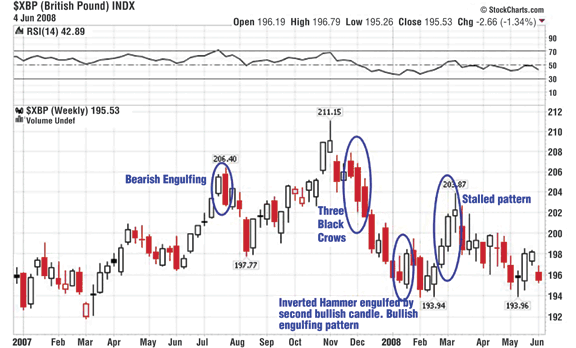
| Candlestick charting has always attracted traders. Although there are other technical tools that work well, combining them with candlestick charting reveals actual market sentiment and enhances the ability to analyze trends. There is a long list of candlestick patterns, but if you understand a few, you're well on your way to becoming a good trader. When it comes to candlestick patterns, what you see is a reflection of the psychology of market participants. Understanding the psychology gives you insight into price movement. Three effective and reliable candlestick patterns are easy to follow. They are: 1) Engulfing patterns (bullish/bearish) ENGULFING PATTERNS Theoretically, the second real body should not be the same color as the first body. The only exception, which is mentioned in Steve Nison's Japanese Candlestick Charting Techniques, is if the first body is a doji. Nison states that after an extended fall, a doji engulfed by a very large white real body could signal a bottom reversal. In an uptrend, if the doji is engulfed by a large black real body, it could be a bearish reversal pattern. You can also have a spinning top instead of a doji as the first body. On the weekly chart of the British pound in Figure 1, there is an example of the application of different patterns. The British Pound Index had an extended upside rally of six strong trading weeks beginning at around 196 in June 2007. In the seventh week there was some selling pressure and by the end of the week the seventh candle hugged the prior day's body, forming a bearish engulfing pattern. According to Steve Nison, we can use the high of the red candle as resistance for a future reversal rally. Nison mentions support and resistance as the prime use of the engulfing pattern. The high at 206 is the resistance, which the index didn't dare to challenge at all. Instead, the index plunged to the 197.77 level within a few weeks. In this bearish reversal pattern, both bodies have small upper and lower shadows. The second body has wrapped the first body entirely. I would also like to explain one classic engulfing pattern from Japanese Candlestick Charting Techniques. Nison states that at times the body can cover not just one but smaller real bodies of a prior trend in between the two main bodies. For example, in the case of a bullish engulfing pattern, the bullish candle can engulf the first black or red candle and even smaller candles if there are any in between these two candles. As mentioned earlier, engulfing the shadows is not necessary, but the real bodies should be wrapped completely. This classic pattern gives a strong reversal signal. The wise trader will look at one simple pattern in different ways to make optimum use of it. THE THREE BLACK CROWS ...[t]he three crows are, as the name implies, three black candles. Likened to the image of a group of crows sitting ominously in a tall dead tree, the three crows have bearish implications. The three lines should close at, or near, their lows. Ideally each of the openings should also be within the prior session's real body. This pattern is more useful for longer-term traders since it completes after the third candle. By then, the market has already corrected substantially and looks as if the declining rally will continue. In Figure 1, 211 was the high made on the previous advance rally. The shooting star candlestick pattern suggested that a top was being formed and a trend reversal was likely. After two uncertain weeks, the index failed to hold up the high and also closed near the low of the day. This was the first hint of weakness by the first black candle session of the three black crows. The second and third candles opened within the body of the previous candle and formed lower lows at the close. The third candle completes the pattern, by which time the index had plunged significantly below the high on the index. The size of the first candle of the pattern was smaller compared to the other two. This also reflects the increasing bearish strength as the pattern matures. By then, the bears have grown stronger and taken over, leaving no space for bulls to hide.
|
| The index, as seen in Figure 1, hit a low of 194, just few points higher than the prior low at 192 in March 2007. Prices fell straight down to 198. The one small bullish day following that drop was not enough to right the bearish force. The correction continued until an inverted hammer formed. The inverter hammer has a much smaller lower shadow and was confirmed on the next bar by the bullish opening. In addition, the bullish candle that reconfirmed the inverted hammer has engulfed it (inverted hammer). This could mean a bullish move is ahead, but the bears were not ready to give up. The real bullish rally was initiated only after moving lower and close to the previous low, which offered stronger support. To really understand what kind of reversal signal can actually start a fresh advance rally, we head to the next pattern, the "three white soldiers." THREE ADVANCING WHITE SOLDIERS
|
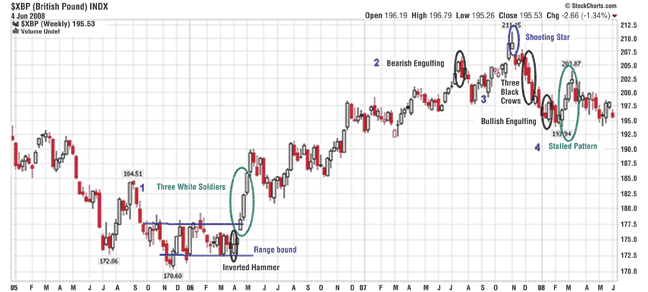
| Figure 2 is a weekly chart of $XBP, with data going back four years. The volatile range-bound phase in 2005-06 was broken and a powerful uptrend was initiated, pulling the index to new highs, consolidating and correcting at every rise. The bullish move started from the lower range of the consolidation with a white inverted hammer, followed by a small white candle that reconfirmed the inverted hammer. The upper range was jumped over by a gap up and the rally began. The gapup violated the strong resistance and the second bullish candle opened near the high of first candle and closed at a new high. The third candle showed a similar move, so the three white soldiers raised the index to a new level. The correction appearing after an extended rally is normal till certain support levels are held. After the range breakout, the index has seen a robust up move and marked new highs. If the second and third or only the third bullish candles shows signs of weakening, then the pattern is an advance block or stalled pattern. This means the rally is slowing down and the journey is about to end. An advance block can be recognized by the long shadows on the second and third candle with a small real body. In a stalled pattern, the first two white candles have large bodies making new highs, followed by a small white candle. Both patterns should be used for protecting long positions and not for initiating short positions. Figure 2 shows a stalled pattern in February 2008. Initially, the rally began on stronger notes, but later, the bull seemed to have lost its power. The third candle hit the highest level on the rally but later failed to sustain near the highs. In addition, the low of the day was not held, so the bullish force was temporarily reduced. As the stalled pattern was complete, the index entered a small correction. Those who would have cut their long positions when the stalled pattern formed would have saved their profits. A long trade on three advance soldiers should be watched very carefully with cautious stop-losses. |
| IMPORTANCE OF REVERSAL PATTERNS The engulfing pattern, three black crows, and three white soldiers are easily understood and can be applied in regular trading. Let's revise how these patterns can be applied to your trading. Figure 2 can help us understand how these patterns can actually be used in your trading. In 2005 after a correction, $XBP entered a consolidation. The breakout of this consolidation lead to a robust upside move. In early April 2005, an "inverted hammer" was formed with the support of the lower range at 172.5. This inverted hammer was the first sign of a reversal rally coming up. Eventually, the upper range was taken off and three consecutive bullish candles appeared, forming three white soldiers. Thereafter, the British pound continued to head higher and made a new high at 205. Here, we can see the bearish engulfing pattern that dragged the index a few points lower. The pattern was strong and noticeable as it appeared at a new high, indicating a temporary pause in the current rally. The small descending move established support immediately at 197 and fueled up the prior rally. At a new high, a shooting star was formed, indicating that the index had topped out and a bearish force likely to take over. As the downtrend began, the three black crows reconfirmed the bearish pressure dragging the index much lower. The red inverted hammer signaled the end to the decline but it took a while for the bulls to gain their power. It wasn't until 2008 that the index regained the strength. Alas, that was a stalled pattern so the bulls still didn't have the strength to carry a rally. |
| SUGGESTED READING Nison, Steve [1991]. Japanese Candlestick Charting Techniques, New York Institute of Finance/Simon & Schuster. StockCharts.com |
Chaitali Mohile is an active trader in the Indian stock markets. She may be reached at chaitalimohile@yahoo.co.in.
| E-mail address: | chaitalimohile@yahoo.co.in |
PRINT THIS ARTICLE

Request Information From Our Sponsors
- VectorVest, Inc.
- Executive Premier Workshop
- One-Day Options Course
- OptionsPro
- Retirement Income Workshop
- Sure-Fire Trading Systems (VectorVest, Inc.)
- Trading as a Business Workshop
- VectorVest 7 EOD
- VectorVest 7 RealTime/IntraDay
- VectorVest AutoTester
- VectorVest Educational Services
- VectorVest OnLine
- VectorVest Options Analyzer
- VectorVest ProGraphics v6.0
- VectorVest ProTrader 7
- VectorVest RealTime Derby Tool
- VectorVest Simulator
- VectorVest Variator
- VectorVest Watchdog
- StockCharts.com, Inc.
- Candle Patterns
- Candlestick Charting Explained
- Intermarket Technical Analysis
- John Murphy on Chart Analysis
- John Murphy's Chart Pattern Recognition
- John Murphy's Market Message
- MurphyExplainsMarketAnalysis-Intermarket Analysis
- MurphyExplainsMarketAnalysis-Visual Analysis
- StockCharts.com
- Technical Analysis of the Financial Markets
- The Visual Investor