HOT TOPICS LIST
- Strategies
- Stocks
- Buy
- Investing
- Brokers
- Psychology
- Interviews
- Accumulate
- Sell
- Hold
- Spotlight
- Websites
- Candlestick Corner
- Gold & Metals
- Options Trading
LIST OF TOPICS
TRADER'S NOTEBOOK
Relative Strength As A Selling Tool
05/08/08 03:50:05 PM PSTby Michael Carr, CMT
Relative strength is well known as a screening tool and a valuable component when it comes to making a buy decision. But what about using it for your sell decision?
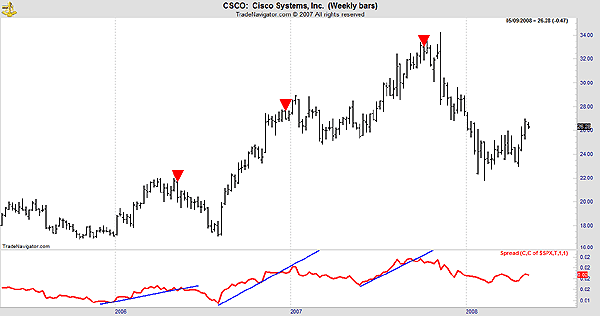
| Traditional relative strength (RS) analysis has helped countless traders spot the next big winner. To apply this strategy, a simple calculation is performed to compare the performance of a basket of stocks or the components of an index to the overall market in order to determine which ones are the strongest. The strongest are bought and the weakest are avoided. This approach works well in bull markets, and applied with discipline, it delivers market-beating performance in bear markets. RS RANKING The formula for investment success is generally understood to be "buy low, sell high." With RS strategies, the formula can be thought of as "buy high, sell higher." Relative strength tells you when prices are high enough to be bought. Unfortunately, it is difficult to determine when prices reach the selling point. Properly employed, RS can help you spot when prices are too high on a relative basis. To apply RS means to compare the performance of a group of stocks to the overall market. This principle means that stocks should be sold when they are underperforming the market. Using the IBD approach, a stock should be sold whenever its RS ranking falls below 50. Adding this idea to the CANSLIM rules would allow traders to let their winners run and provide objective rules for selling, another critical factor to long-term investment success. CHARTING THE RS LINE An example of this analysis can be seen in Figure 1. I used a weekly chart because I find that RS works best over the intermediate-term time frame. Academic studies show that in the short term and the long term, stock prices are generally mean-reverting. Trend-following in stocks seems to work best over three- to 12-month time frames. Cisco (CSCO) shows three RS trendline breaks, all of which occurred shortly before a top. That is an interesting characteristic of this technique. The signals usually come early because a stock's momentum often slows as it nears a peak.
|
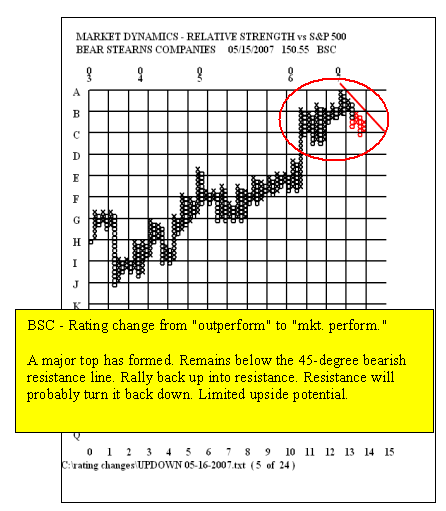
| POINT & FIGURE OF RS Another visual RS approach to selling has been detailed by portfolio manager Clay Allen in his book Winning The Performance Game. Allen creates point & figure charts of a stock's relative strength and sells when there is a violation of the 45-degree bullish support line and a triple bottom sell signal occurs. The basic P&F chart is a study of pure price movement. It shows columns of Xs and Os. A column of Xs means that the price of the security is rising, while Os means it is falling in price. Only one is plotted at a time, and usually only Xs or Os are placed in a single column. To construct a P&F chart, you have to first decide what box size to use. Box size will represent the amount of price movement represented by a single X or O. With a box size equal to one, each X or O would represent a one point price change. Anything less than the one-point price change would be disregarded. The other variable in a P&F chart is the reversal criteria, which is the number of boxes required for a reversal from Xs to Os or vice versa. Price reversals that do not meet the minimum reversal criteria are disregarded. Often, a price reversal value of at least three points will be used. To clarify that, if price is moving lower, it is being recorded as a column of Os. When it reverses by at least three points, a new column of Xs will be created. Similarly, if price is going up, a three-point reversal will result in a new column of Os. One of the most important features of this charting technique is that day-to-day market noise is filtered out, making it easier to spot the long-term trend. Instead of price, Clay Allen charts relative strength, applying the same principles. An example of this technique is shown in Figure 2. Bear Stearns (BSC) was a well-known investment firm that suffered a spectacular decline in March 2008. Fundamental analysts lowered their rating nearly a year before BSC became nearly worthless. As practiced by Allen, RS analysis gave a clear sell signal on May 15, 2007, while the price of BSC was above $150 a share. On a weekly basis, BSC never closed higher after that signal and eventually plunged as low as $2.84 a share.
|
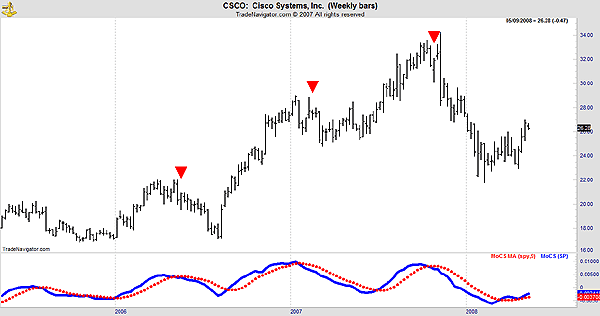
| MOMENTUM An additional RS technique you should consider is the momentum of comparative strength (MOCS) indicator developed by market technician Christopher Hendrix. MOCS substitutes an RS calculation for price into the traditional moving average convergence/divergence (MACD) formula. MACD is a popular indicator that measures the difference between a short-term and long-term moving average (MA) of closing prices. The longer moving average is subtracted from the shorter moving average to generate the signals. As with all momentum indicators, the theory is that this calculation of a stock's momentum will show when prices are changing directions. A positive value of MACD indicates that the short-term MA is higher than the long-term MA, while a negative MACD means the short-term MA is less than the longer-term MA. When MACD is positive and rising, the gap between the two MAs is widening, and the rate of change of the short-term MA is higher than the rate of change for the long-term MA. This should result in higher prices for the stock. If MACD is negative and declining further, downward momentum is accelerating, and traders should expect to see lower prices. By adapting this indicator as a measure of RS, Hendrix offers yet another visual tool to apply for clear trading signals. The formula for MOCS is: MoCS = (12-period EMA of (Stock/S&P 500)) - (26-period EMA (Stock/S&P 500)) where: Exponential moving averages are often used by technicians to reduce the time lag introduced with simple moving averages to generate signals. EMAs do this by overweighting the importance of more recent prices, with the degree of overweighting determined by the specified period of the EMA. Shorter-period EMAs give more weight to recent prices than longer period EMAs. In the MOCS formula, the most recent closing price accounts for 15% of the value of the shorter, 12-period EMA; the slower, 26-period EMA allocates about a 7.5% weighting to the most current price. This emphasis on recent prices means that an EMA will react quicker to market action when compared to a simple moving average, which equally weights all datapoints. Just like with the MACD, trading signals are generated when a nine-period EMA of the MOCS crosses above or below the current value of the MOCS. An example is shown in Figure 3. Sell signals occur when the MOCS falls below its EMA. One advantage of MOCS is that it compares the movement of a stock to the overall market but allows you to apply an RS strategy to a single security. This is simpler than the traditional approach, which requires that an investment universe be rank-ordered and sorted into percentiles. Figure 3 shows that there are clear sell signals based only upon the behavior of this stock compared to the market.
|
| Another consideration with this technique is that it can be applied to any technical indicator by adapting the formula to use a RS ratio instead of the stock's closing price. It is a highly adaptable strategy that can employ relative strength index or stochastics, for example, instead of using MACD. Alternatively, investors can change the time periods for MACD to generate a greater or lesser number of signals. RS FOR SELL SIGNALS |
| RELATED READING Allen, Clay [2005]. Winning The Performance Game, Lulu.com. Carr, Michael [2008]. Smarter Investing In Any Economy, W&A Publishing. |
Mike Carr is a member of the Market Technicians Association and editor of the MTA's newsletter, Technically Speaking. He is a full-time trader and writer.
| E-mail address: | mcarr@dunnwarren.com |
PRINT THIS ARTICLE

|

Request Information From Our Sponsors
- VectorVest, Inc.
- Executive Premier Workshop
- One-Day Options Course
- OptionsPro
- Retirement Income Workshop
- Sure-Fire Trading Systems (VectorVest, Inc.)
- Trading as a Business Workshop
- VectorVest 7 EOD
- VectorVest 7 RealTime/IntraDay
- VectorVest AutoTester
- VectorVest Educational Services
- VectorVest OnLine
- VectorVest Options Analyzer
- VectorVest ProGraphics v6.0
- VectorVest ProTrader 7
- VectorVest RealTime Derby Tool
- VectorVest Simulator
- VectorVest Variator
- VectorVest Watchdog
- StockCharts.com, Inc.
- Candle Patterns
- Candlestick Charting Explained
- Intermarket Technical Analysis
- John Murphy on Chart Analysis
- John Murphy's Chart Pattern Recognition
- John Murphy's Market Message
- MurphyExplainsMarketAnalysis-Intermarket Analysis
- MurphyExplainsMarketAnalysis-Visual Analysis
- StockCharts.com
- Technical Analysis of the Financial Markets
- The Visual Investor


