HOT TOPICS LIST
- Strategies
- Stocks
- Buy
- Investing
- Brokers
- Psychology
- Interviews
- Accumulate
- Sell
- Hold
- Spotlight
- Websites
- Candlestick Corner
- Gold & Metals
- Options Trading
LIST OF TOPICS
CANDLESTICK CORNER
Candlestick Reversal Patterns
11/21/07 03:01:34 PM PSTby John Devcic
Candlestick patterns can be invaluable in identifying a possible tren reversal.
| Identifying candlestick reversal patterns is not easy. But with patience and persistence it can be done. Chart reading is an art form and an important part of a chart reader's arsenal. In this article I will focus on a couple of very important patterns that can help spot a reversal of a current trend. As with all candlestick patterns, these patterns will also take time and patience to learn, but once mastered they will be an invaluable resource. REVERSAL PATTERNS A reversal pattern could signal a possible end of the current trend or it could signal a continuation of the trend. There are two types of reversal patterns, bullish and bearish. A bullish reversal pattern will appear at the end of a downtrend and a bearish reversal pattern will appear at the end of an uptrend. A reversal of the current trend signifies that the selling or buying pressure subsided for that trading day. There are different ways to spot reversals. I prefer to use candlestick charts since, in my opinion, they reveal a very detailed representation of that trading day. From a visual standpoint, candlesticks are a great tool to help you spot one of these reversals once you learn to spot the formations. THE COMMON REVERSAL PATTERNS
|
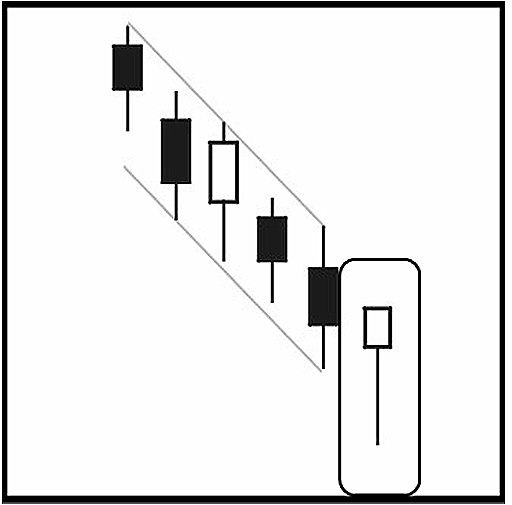
| Hammer — This is a bullish reversal pattern that forms after a decline (Figure 1). Hammers usually help you locate a bottom or possible level of support. A hammer has a long range but with a small body formed at the top. The long line represents sellers driving the price down but they could not continue to drive the price lower and eventually the stock finishes higher. But spotting the hammer pattern is not enough. You need some other confirmations in addition to this pattern to indicate a change in the current downtrend. After the hammer pattern is formed, you want to see a continuation of buying with strong volume to really signal a change. The long thin line on the hammer is what is most important because it tells you that the sellers are still there. Seeing the hammer formation cannot be used as a signal by itself. What you need to look for:
|
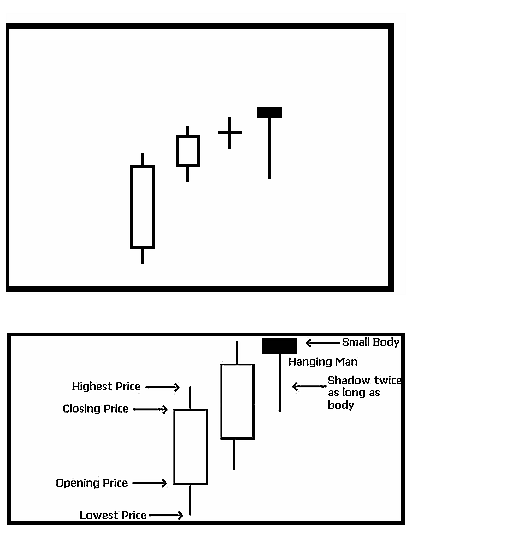
| Hanging man — This is a bearish reversal pattern that may signal the end of the current uptrend. The hanging man looks similar to the hammer except that it shows there are sellers able to drive the stock down (Figure 2). That long narrow line represents sellers coming in and driving the stock down. In most cases, the stock will even finish lower for the day. The bulls were able to drive the stock up at some point but were unable to have it close higher. As with the hammer, seeing the hanging man pattern alone will not be enough to act on. You need to look for confirmation of the trend change. This confirmation comes in the form of lower closes following the formation of the hanging man. What you need to look for:
|
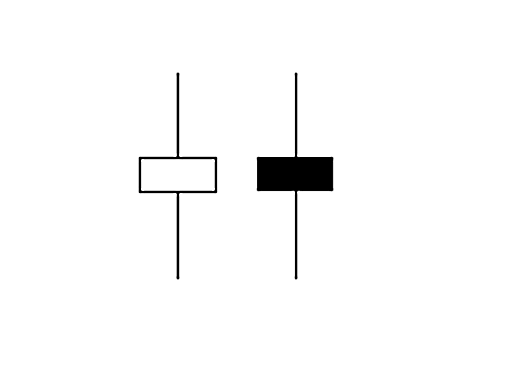
| Spinning tops — This pattern really highlights indecision on that specific trading day. Neither the bulls nor bears were able to gain enough momentum that day, which is why this pattern was formed (Figure 3). The interesting thing about this pattern is its complexity. You have a small body that is either hollow or filled in. What is more important is that you have a long shadow. This long shadow indicates that there was a lot of movement both higher and lower that day. Oftentimes, this pattern forms after a current long trend. This signifies that there could be a reversal in that trend. For example, after a long advance or a series of strong candlesticks, seeing a spinning top tells you that selling pressure is starting to gain momentum and may lead to a reversal of the strong buying. On the other hand, after a long decline or filled in candlestick (usually black) a spinning top can indicate that the selling pressure is subsiding and this could potentially signal a trend reversal. A spinning top alone is not a signal of a reversal. You need to get confirmation before you can make a trading decision based on spotting a spinning top. However, the spinning top is a good indicator that the current trend is starting to lose momentum and a possible reversal could occur. |
| WHEN TO PLACE THAT TRADE None of these candlestick patterns mentioned here will guarantee a reversal of a current trend. They become invaluable in identifying a possible trend reversal, however. There can be external forces that may again continue the preexisting trend regardless of either the hammer or hanging man pattern being formed. The hammer and hanging man are the same pattern, except they appear at different times. Once you learn to identify one you will be able to identify the other easily. It is important to keep in mind that identifying the pattern is only the first step. The next depends on you as an investor and your investing philosophy. That means you will have to decide when to pull the trigger on the trade based upon these patterns. Learning to find formations using candlestick patterns can give you the edge when trading. |
John Devcic is a market historian and freelance writer. He may be reached at drmorgus@gmail.com
| E-mail address: | drmorgus@gmail.com |
PRINT THIS ARTICLE

|

Request Information From Our Sponsors
- VectorVest, Inc.
- Executive Premier Workshop
- One-Day Options Course
- OptionsPro
- Retirement Income Workshop
- Sure-Fire Trading Systems (VectorVest, Inc.)
- Trading as a Business Workshop
- VectorVest 7 EOD
- VectorVest 7 RealTime/IntraDay
- VectorVest AutoTester
- VectorVest Educational Services
- VectorVest OnLine
- VectorVest Options Analyzer
- VectorVest ProGraphics v6.0
- VectorVest ProTrader 7
- VectorVest RealTime Derby Tool
- VectorVest Simulator
- VectorVest Variator
- VectorVest Watchdog
- StockCharts.com, Inc.
- Candle Patterns
- Candlestick Charting Explained
- Intermarket Technical Analysis
- John Murphy on Chart Analysis
- John Murphy's Chart Pattern Recognition
- John Murphy's Market Message
- MurphyExplainsMarketAnalysis-Intermarket Analysis
- MurphyExplainsMarketAnalysis-Visual Analysis
- StockCharts.com
- Technical Analysis of the Financial Markets
- The Visual Investor


