

HOT TOPICS LIST
- Strategies
- Stocks
- Buy
- Investing
- Brokers
- Psychology
- Interviews
- Accumulate
- Sell
- Hold
- Spotlight
- Websites
- Candlestick Corner
- Gold & Metals
- Options Trading
LIST OF TOPICS
TRADER'S NOTEBOOK
The Buying Myth Debunked
10/24/07 03:26:09 PM PSTby Mike Carr, CMT, and Matt Blackman
The greatest factor separating the successful market player from the rest may well be his or her systematic approach to selling.
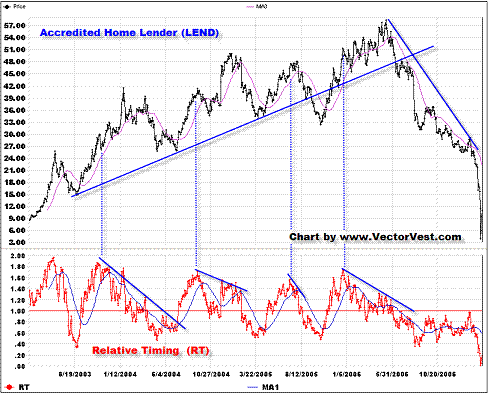
| Traders and investors the world over can always explain why they buy; the company's coming out with a new product that will dominate the marketplace, or there was a moving average convergence/divergence (MACD) crossover signal coincident with a bullish relative strength index (RSI) divergence, or any number of other triggers. For many, buying is 90% of the game, which explains why the search for the holy grail of techniques fills the pages of trading publications and websites. More often than not, however, those same investors who have devoted considerable time and energy to finding the perfect entry have no idea when to exit, nor do they see it as a priority. In "The Loser's Game," a 1995 article in the Financial Analysts Journal, Charles Ellis illustrated the importance of the sell decision by relating investment management to professional sports. Ellis uses the sport of tennis to describe the differences between playing a winner's game or a loser's game: Expert tennis is what I call a Winner's Game because the ultimate outcome is determined by the actions of the winner. Victory is due to winning more points than the opponent wins--not, as we shall see in a moment, simply to getting a higher score than the opponent, but getting that higher score by winning points. Amateur tennis, Ramo found, is almost entirely different. Brilliant shots, long and exciting rallies and seemingly miraculous recoveries are few and far between. On the other hand, the ball is fairly often hit into the net or out of bounds and double faults at service are not uncommon. The amateur duffer seldom beats his opponent, but he beats himself all the time. The victor in this game of tennis gets a higher score than the opponent, but he gets that higher score because his opponent is losing even more points. The segue to investing is a small one. We have all heard that 80–90% of traders end up losing and that more than 80% of options contracts expire worthless. Ellis explains these numbers and goes on to point out that like the professional tennis players, the most successful money managers play a winner's game by making the fewest mistakes while most investors play a loser's game on the path to becoming statistical market roadkill. Ellis's remedy to increase the odds of success may sound simple, but it's not — we must actively limit losses. Some rudimentary arithmetic proves the point — a 33% loss requires a gain of 50% to breakeven; losing 50% means the price must double to get back to even. For most of us, it's hard enough to find investments that return 20%, so the outsized returns required to compensate for big losers would be a huge drag on future performance. STARTING AT THE END... Selling, especially when we are in a loss position, is anything but. Hope and greed have turned to fear and pain, and putting it off seems easier than facing up to it. We are also hit head-on with the unpleasant realization that we are wrong, our ego is hurt, and that makes it even more painful. Besides, tomorrow is a new day and the stock might rally. Hope rules the day and decisions at this point are anything but logical. Professionals see it differently. As long-time futures trader, author, and educator Larry Williams once said, "I enter every trade expecting to lose and act accordingly. That way, I never overextend my welcome or my account margin requirements." Williams, normally an optimist, says optimism can be deadly in a trade. Optimism keeps the trader in a losing trade because he or she believes that the price will eventually turn in their favor, even when their homework is telling them otherwise. By taking a pessimistic approach, Williams makes a hasty exit as soon as his stop is hit. No temptation to overstay his welcome. Looking at it from a fundamental point of view, if we buy based on a story, we should sell when that story is no longer true. For example, if ABC Co. is coming out with the next killer application for the Internet, we want to buy before the product is released, and then we need to watch sales and closely monitor market share. If product sales don't meet expectations, it's time to sell the stock. On the other hand, if sales meet or exceed expectations, we hold our position or even add to it, provided the stock is moving higher. Technical analysts trade price movement using clearly defined rules as opposed to stories, but they have equal difficulty exiting a trade. Most of us are familiar with the concept of an initial stop; if price drops 8% to 10% below the purchase price, the stock should be sold. One problem with this rule is that it doesn't account for a stock's price level or volatility. For a low-priced stock, 10% may not cover the bid–ask spread. With volatile stocks, this range may be within the normal price action over a dull week. Another problem with this rule is that it doesn't address the best problem an investor can face — when to sell winners. It's important to let winners run and maximize profits without being shaken out of a position by short-term action related to market noise. Again, technical analysis offers a solution. If price breaks a trendline or pattern support level, a sell rule is triggered and the position is closed. If a stock is moving up, the chart will show a pattern of higher highs and higher lows. By drawing a line to connect the lows, we have an up trendline. A lower low will cross below that line, and trigger a sell signal. (In a downtrend, simply connect the highs and exit a short trade when the downtrend line is violated to the upside.) One objection from long-term investors is that this increases trading costs. But if longer-term (weekly or monthly) charts are used, positions can be safely maintained, and trendline breaks will usually signal serious problems. We witnessed a great example of this as the NASDAQ collapsed at the end of the of Internet bubble. Closing open positions on a trendline break would have saved investors a great deal of money. Price movements also create telltale patterns on charts. Many readers are familiar with head & shoulders tops and bottoms, rectangles, triangles, pennants, or flags that signal price changes to the astute observer. While traders may take action based upon hourly charts or even shorter time frames, long-term investors can look at weekly or monthly charts for clues about future price movements. While not infallible, price patterns help investors exit before big losses occur. TECHNIFUNDAMENTAL COCKTAIL While price is often the first indication of something gone wrong with a stock, a decline in fundamentals can provide valuable early warning. In Figure 2, while stock price for Accredited Home Lender (LEND) continued to move up well into 2006, earnings growth plateaued in May 2004 and began to decline more than two years before the stock price began its stomach-churning spiral from $56 in June 2006 to $10 in early 2007. Another useful exercise is to combine price direction, the magnitude of a stock's recent price changes, and the dynamics of these changes over time. This information is reflected in the relative timing indicator (RT), which is expressed on a scale of 0.00 to 2.00. When RT is above 1.00, price is in a sustainable uptrend and is a buy candidate. If RT is falling and is below 1.00, the stock should be avoided or sold (see Figure 1). This is another reflection of price momentum that acts like an overbought, oversold oscillator except that it often anticipates price moment and is therefore an excellent divergence indicator. |
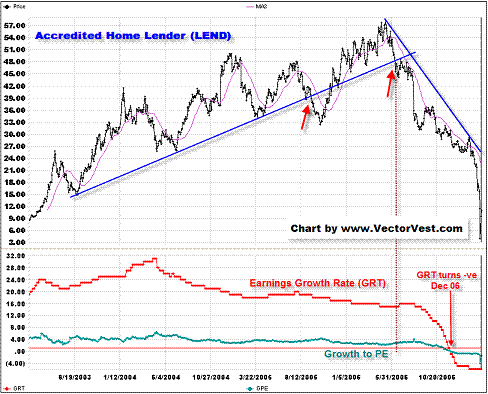 FIGURE 1: MORTGAGE LENDER ACCREDITED HOME LENDER (LEND) WITH THE RELATIVE TIMING INDICATOR (LOWER SUBGRAPH) DIVERGENCE WARNINGS. When an indicator like relative timing in this chart begin breaking down as price increases, it often warns of a correction or change in the direction of the trend. Chart by www.VectorVest.com As we see in Figure 1, RT often bottoms before price and turns up in advance of price, making it a valuable divergence indicator. Conversely at or near tops, it begins to fall and in some cases has been falling for a while before price finally rolls over. Combining technicals with fundamentals should provide investors with a true edge in the markets, offering the best chance of success. In Figure 2, a different chart of LEND shows that price can continue to rise in the face of deteriorating fundamentals. Although the earnings growth rate peaked in May 2005, the stock continued moving higher for another year. Combining this fundamental fact with a trendline break in August 2006 would have provided a good selling point. The investor would have missed the blow-off top that followed that sell signal, but prices declined rapidly after the second trendline break and profits disappeared.
|
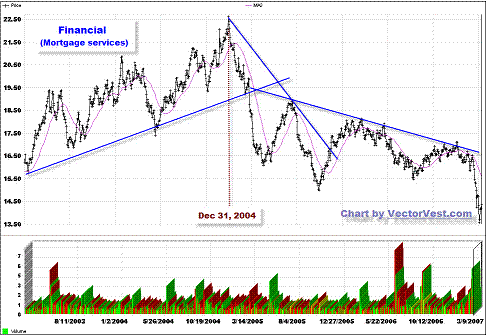
| It's also interesting to note in Figure 2 that the earnings growth rate actually turned negative in December 2006. Price had already declined 50% when a decisive fundamental sell signal was given. The timing of fundamental signals cannot be known in advance. Investors can monitor fundamental indicators and be prepared to sell when they see the first signs of price deterioration; the timing of the sell should rest on technicals. It's relatively easy to draw a trendline into the future or note a key support level on a chart. Prudent investors can enter stop orders at these prices in advance, and protect their profits automatically. Finally, in our bottom-up approach, it is also important to look to the industry to find out if it is also strong or looks to be weakening. This will exert gravitational pull on all stocks in the sector. As we see in Figure 3, the mortgage index topped in December 2004 about six months after earnings growth peaked for LEND in Figure 1. This was further confirmation that there was trouble ahead.
|
| Whether fundamental, technical, or a combination of the two, the common thread is that both buying and selling decisions should be based on a logical set of events or criteria — criteria that removes the potentially destructive emotional fearsome foursome — greed, fear, hope, and despair. Equally as important, like a hammer and nail, buying and selling decisions are inextricably linked. One is no good without the other being present at the same time. GAME, SET, MATCH As football coach Vince Lombardi once said, "Winning isn't everything, it's the only thing." Like any good sport, market players who have the discipline to follow a successful strategy become the champions of a game in which he who loses least often, ultimately stands triumphant. And having a speedy exit ready to use at a moment's notice is an essential part of that plan. Then, like the pilot getting ready to eject from his burning aircraft, the only challenge left is in summoning the courage to push the button (or call your broker) and trust in the outcome. |
| SUGGESTED READING DiLiddo, Bart [1998]. Stocks, Strategies & Common Sense, HSC Publishers. Ellis, Charles [1995]. "The Loser's Game," Financial Analysts Journal. |
Matt Blackman is a full-time technical and financial writer and trader. He produces corporate and financial newsletters, and assists clients in getting published in the mainstream media. He is the host of TradeSystemGuru.com. Matt is a member of the Canadian Society of Technical Analysts. He can be reached at indextradermb@gmail.com. Find out what stocks and futures Matt is watching on Twitter at http://www.twitter.com/MattBlackmanCMT
Mike Carr is a member of the Market Technicians Association and editor of the MTA's newsletter, Technically Speaking. He is a full-time trader and writer.
PRINT THIS ARTICLE

Request Information From Our Sponsors
- StockCharts.com, Inc.
- Candle Patterns
- Candlestick Charting Explained
- Intermarket Technical Analysis
- John Murphy on Chart Analysis
- John Murphy's Chart Pattern Recognition
- John Murphy's Market Message
- MurphyExplainsMarketAnalysis-Intermarket Analysis
- MurphyExplainsMarketAnalysis-Visual Analysis
- StockCharts.com
- Technical Analysis of the Financial Markets
- The Visual Investor
- VectorVest, Inc.
- Executive Premier Workshop
- One-Day Options Course
- OptionsPro
- Retirement Income Workshop
- Sure-Fire Trading Systems (VectorVest, Inc.)
- Trading as a Business Workshop
- VectorVest 7 EOD
- VectorVest 7 RealTime/IntraDay
- VectorVest AutoTester
- VectorVest Educational Services
- VectorVest OnLine
- VectorVest Options Analyzer
- VectorVest ProGraphics v6.0
- VectorVest ProTrader 7
- VectorVest RealTime Derby Tool
- VectorVest Simulator
- VectorVest Variator
- VectorVest Watchdog