HOT TOPICS LIST
- Strategies
- Stocks
- Buy
- Investing
- Brokers
- Psychology
- Interviews
- Accumulate
- Sell
- Hold
- Spotlight
- Websites
- Candlestick Corner
- Gold & Metals
- Options Trading
LIST OF TOPICS
CANDLESTICK CORNER
The Candlestick Kicker
10/04/07 01:14:37 PM PSTby Stephen W. Bigalow
Is it the most powerful candlestick signal?
| Do you chase a stock that is already up 12% on the day? What do you do when one of the companies you own stock in announces an earnings warning? What do you do when one of your stocks, previously uptrending, turns around and plummets after announcing an SEC investigation? Or the Federal Reserve Board announces a surprise rate hike, and bond prices gap down from one minute to the next and move in the opposite direction of the previous trend? Not surprisingly, these situations paralyze most investors. Fortunately, candlestick charting can keep you from falling into traps. When such a price action takes place, you will usually find a kicker signal on a candlestick chart. The kicker signal has powerful implications. The one basic factor built into candlestick signals is that they are formed by the cumulative knowledge of all the investor input, the buying and selling, of a trading entity or trading entities during a certain time period. The candlestick signals tell you exactly what investor sentiment is doing. The kicker signal illustrates a dramatic change in investor sentiment. Candlestick analysis allows investors to project trend reversals with a relatively high degree of accuracy. One misconception about candlesticks signals is that there are too many of them to learn. But of the 50 or 60 candlestick signals, there are only about 12 signals that occur most of the time — the doji, the bullish and bearish engulfing signals, the hanging man, shooting star, hammer, the inverted hammer, the bullish and bearish harami, the dark cloud, the piercing pattern, and the kicker signal. Knowing these few signals will sharply improve your analysis of trend reversals and make learning candlestick analysis much easier. Having this analysis capability in your trading arsenal allows candlestick investors to have their portfolios positioned in the correct direction when a move occurs. Understanding the psychology of how signals are formed provides investors with better foresight in where to have positions placed. Big dramatic moves! What do you do? Many investors act like deer frozen in headlights, but candlestick analysis tells you instantly what to do. An announcement can completely reverse a trend direction. If a trend has been in progress, whether strong or mild, and a surprise announcement is made, how that formation rolls out will tell the investor what to do. One possibility is observing the previous day's candle formation with the open price, then the closing price continuing in the direction of the existing trend. After the announcement, the price alters its direction, opening at the same level as the previous day, a gap open, and proceeding to close in the direction opposite of the previous day. This is known as the kicker signal, and it is a high-powered candlestick signal. This signal should never be ignored. It can create huge profits. Candlestick signals are fractal. They can occur on a daily, weekly, or monthly chart just as well as on a one-, five-, or 15-minute chart. The Japanese rice traders identified approximately 50 reversal and continuation signals through centuries of developing candlestick signals. Of these, the 12 major signals will provide more trades than most investors will ever need. |
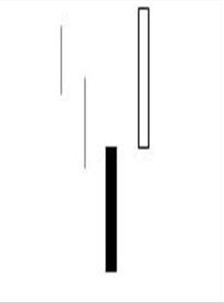
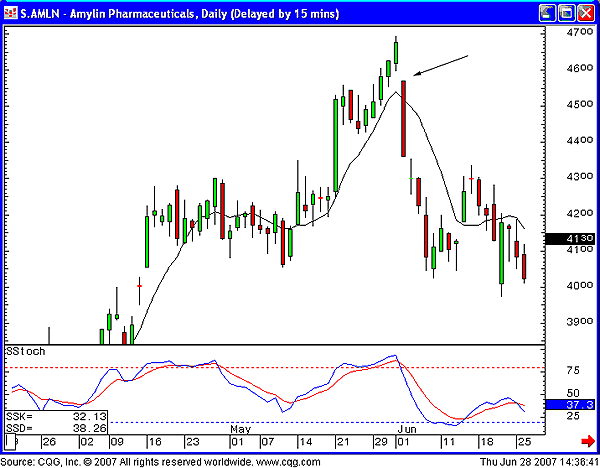
| THE KICKER The kicker signal, which may be the most powerful signal of all, works equally well in both directions. Its relevance is magnified when occurring in the overbought or oversold area but is effective no matter where it appears in a price trend. Consider the investment sentiment that built this pattern. It is formed by two candles. The first candle opens and moves in the direction of the current trend. Investors are continuing with the established trend, closing the price further in the existing direction. Then something occurs to change the direction of the price; usually, surprise news causes this type of move. The signal illustrates such a dramatic change from the current price direction that the new direction will persist for a good while. (One caveat to this signal — if prices gap back the other way in the next time frame, liquidate the trade immediately. This does not happen often, but when it does, get out.) The second candle opens at the same open as the previous day, a gap open, and heads in the opposite direction of the previous day's candle. The bodies of the candles are opposite colors. This formation is indicative of a dramatic change in investor sentiment. The candlesticks visually depict the magnitude of the change. Understanding what forms a kicker signal produces a strong trading discipline for investors. If you own a position that has had a nice steady uptrend and one morning you see an announcement that causes the price to open below the open of the previous day's bullish candle, a trade decision can be made immediately: Get out on the open. Candlestick analysis makes it simple. If an announcement alters the direction of the current price trend with such magnitude that it is gapping the price down below the previous day's open, you can make one assumption. The investor sentiment of the current uptrend has been dramatically altered. A gap down below a previous day's bullish candle now has the strong potential of forming a bearish kicker signal (Figure 1). With the understanding that the kicker signal is one of the strongest reversal signals identified, logic dictates that you do not want to remain in a long position with strong downside indications. This is common sense investment practice depicted by candlestick signals. The probabilities indicate that a negative announcement, causing the price to gap down, would not be opening lower and immediately continuing back up (Figure 2).
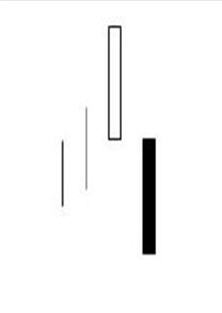
If an announcement creates a gap up in price above the previous day's open, in a stock downtrend, an investor should take advantage of a large profit potential in the earliest stage. A gap up above the previous day's open signifies that whatever was announced has now dramatically changed the investor perception of that price. If you wake up and see an announcement that is gapping the price up above the previous day's open, you can assume that the strength of the announcement is now going to create a bullish kicker signal (Figure 3). Even though the price has moved a good percentage from the previous day's close, a potential formation of a kicker signal is usually the prelude to a strong uptrend. This allows an investor to act immediately versus worrying about how much the price is already moved from yesterday's close. |
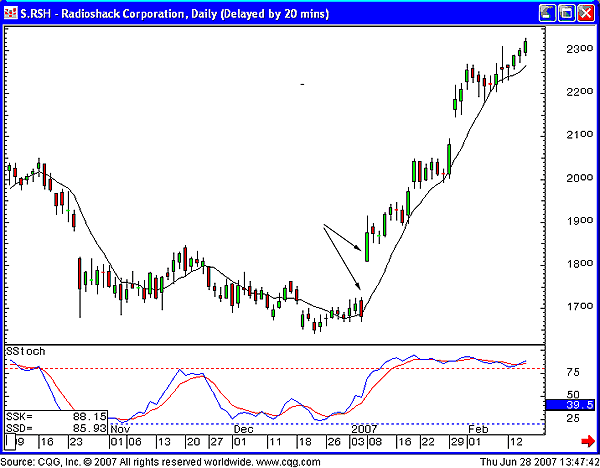
 FIGURE 3: BULLISH KICKER SIGNAL As illustrated in the RadioShack chart in Figure 4, whatever announcement created the kicker signal produced new investor sentiment that developed into a strong uptrend. The strength of the uptrend was immediately apparent, with the price gapping up well above the previous day's open. |
 FIGURE 4: A CHANGE IN INVESTOR SENTIMENT. Announcements can dramatically change the prospects of a company. Do all kicker signals create strong price moves? Not always! However, based upon the circumstances that create the signal, the results expected will occur with such a high percentage of positive results that executing trades upon seeing the formation or the completion of a kicker signal would dramatically improve the returns of a portfolio. |
| SUGGESTED READING Bigalow, Stephen W. [2001]. Profitable Candlestick Investing, John Wiley & Sons. _____ [2005]. High Profit Candlestick Patterns, Profit Publishing. |
Stephen W. Bigalow is an author and the principal of the www.candlestickforum.com, a website for providing information and educational material about candlestick investing.
| Website: | www.candlestickforum.com |
| E-mail address: | sbigalow@msn.com |
PRINT THIS ARTICLE

|

Request Information From Our Sponsors
- StockCharts.com, Inc.
- Candle Patterns
- Candlestick Charting Explained
- Intermarket Technical Analysis
- John Murphy on Chart Analysis
- John Murphy's Chart Pattern Recognition
- John Murphy's Market Message
- MurphyExplainsMarketAnalysis-Intermarket Analysis
- MurphyExplainsMarketAnalysis-Visual Analysis
- StockCharts.com
- Technical Analysis of the Financial Markets
- The Visual Investor
- VectorVest, Inc.
- Executive Premier Workshop
- One-Day Options Course
- OptionsPro
- Retirement Income Workshop
- Sure-Fire Trading Systems (VectorVest, Inc.)
- Trading as a Business Workshop
- VectorVest 7 EOD
- VectorVest 7 RealTime/IntraDay
- VectorVest AutoTester
- VectorVest Educational Services
- VectorVest OnLine
- VectorVest Options Analyzer
- VectorVest ProGraphics v6.0
- VectorVest ProTrader 7
- VectorVest RealTime Derby Tool
- VectorVest Simulator
- VectorVest Variator
- VectorVest Watchdog


