

HOT TOPICS LIST
- Strategies
- Stocks
- Buy
- Investing
- Brokers
- Psychology
- Interviews
- Accumulate
- Sell
- Hold
- Spotlight
- Websites
- Candlestick Corner
- Gold & Metals
- Options Trading
LIST OF TOPICS
TRADER'S NOTEBOOK
The Manic Marriage Between Bonds And Stocks
08/16/07 01:57:05 PM PSTby Matt Blackman
Can this long-term intermarket match survive the strain?
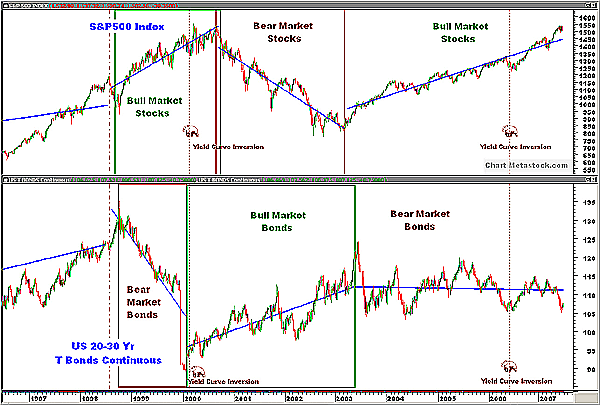
| Throughout history, stocks and bonds have responded together to market conditions. Whether in a rally or a correction, bonds moved first and stocks religiously followed. But all that ended in 1997. Is there hope for a revival, or is the traditional relationship over? And what does it mean for stock markets going forward? Intermarket analysis, the study of the interplay among asset classes, tells us that stocks, bonds, and commodities move together in predictable accordance. In a rally, bonds have traditionally moved first, then stocks, followed by commodities. In a correction, they roll over in the same order. But as the 20th century wound to a close, the close-knit relationship between stocks and bonds suffered a seismic shift due to an event that began to unwind across the Pacific Ocean and for which currency trader George Soros became the speculator scapegoat. In July 1997, the Thai baht began to plummet against the major currencies. It was the first casualty and was followed closely by the Malaysian ringgit. Rather than take responsibility for problems with his nation's currency, Malaysian Prime Minister Mahathir Mohamad pointed a finger at George Soros as the currency culprit. While singling out Soros as the source of their troubles was laughable, the Asian politicians and central banks had no one to blame but themselves for subsequently jacking up interest rates in a misguided attempt to fix the problem. Higher rates resulted in a massive selloff in Pacific Rim stocks, turning a regional single-market problem into a global intermarket tsunami. Before it was done, stock, bond, and commodity prices around the world would take a big hit and Russia and Argentina suffer financial collapses. The Asian contagion was the spark that eventually culminated in the US stock meltdown in 2000. Analyst John J. Murphy, the first to identify the major shift in the stock-bond relationship and write about it (in the 1998 update of Technical Analysis Of The Financial Markets), has said this was the most important long-term impact of the "Asian flu." He described the consequent decoupling of stocks and bonds, which he defined as a shift that caused the two to begin trending in the opposite direction. And by the second half of 1997, it had spread to US markets. The underlying reason for the crisis, Murphy believes, was a deflation that began in Japan in 1990 following the collapse of property and stock markets there. After peaking in March 1996, the Commodity Research Bureau Index, a basket of commodities that includes everything from oil and gold to industrial metals and grains, dropped 30% by 1999. The index recovered and dropped again before finally bottoming in September 2001. Japanese deflationary pressure spread, and the collapse of smaller Asian currencies was the catalyst that triggered the blast felt round the globe in 1998-2000. Futures trader and host of www.TraderBlog.com Jim Wyckoff, who writes a free daily newsletter on commodities, bonds, and currencies for www.TraderEducation.com as well as a biweekly market outlook for www.TraderChat.com, says that cheap imports from Asian powerhouses like China are a mixed blessing. A low-cost labor force has allowed them to produce goods inexpensively, which has been good for the consumer. But the trend has had a negative impact on the manufacturing sector as well as related jobs and salaries in the US. Deflationary pressure has been the byproduct. Wyckoff doesn't see an end in the deflationary trend or a recoupling of stocks and bonds anytime soon. Continued high oil prices will also be a challenge to both the economy and markets going forward, he says. FAST FORWARD In the first week of June 2007, the trendline was breached again in a challenging time for both stocks and bonds. The recovery in bond prices that followed was good news for the economy because it meant that interest rate pressures remained contained. In the good old pre-1997 days, this would have also been positive for stocks. But if the disconnect between the two were still alive and well, a bounce in bonds would mean lower stock prices ahead. Another casualty of the stock-bond disconnect in 1997 was the bond leadership role. In 1998 they both reversed around the same time in September as the S&P 500 began to rally and the 30-year T-bonds entered a bear market. But after bonds next reversed direction in March 2000 and began rallying, the S&P topped out and began to drop. In the next reversal, stocks bottomed first and began a new bull market in March 2003, but bonds didn't top out and begin their bear market until late June (see Figure 1) in what could be called the stock-bond leadership flip-flop. So it's not clear whether stocks or bonds will lead in the next reversal.
|
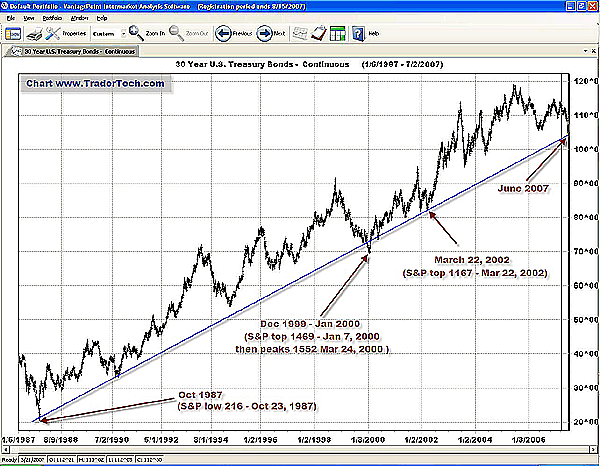
| WRITING A STOCK-BOND PLAYBOOK What event has the highest likelihood of occurring next? Based on the long-term trendline, bonds look to be resuming an uptrend, unless the latest rally was false. Given the new reactionary relationship between stocks and bonds, however, a bottom in bonds does not bode well for stocks. As Figure 2 shows, each time since 1997 that bonds touched their long-term trendline also marked a top in stocks. The December 1999 to January 2000 bond trendline breach coincided with a midterm S&P top of 1469 but, more important, was just three months before major tops in both the S&P and NASDAQ Composite. The next time bonds touched the trendline in March 2002 coincided with the last bear market hurrah for the S&P as it topped at 1167. Four months later, the index had dropped 32% to below 800. |
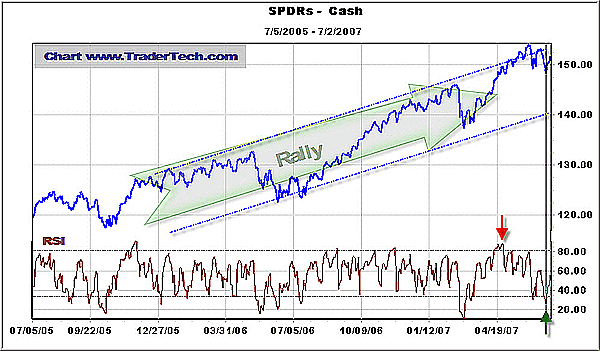 FIGURE 3: Daily chart of the S&P Spyders (SPDR), a fund that tracks the S&P 500. After generating an RSI sell signal in April, the stock peaked June 1 and looked poised to retrace back to its lower trend channel.
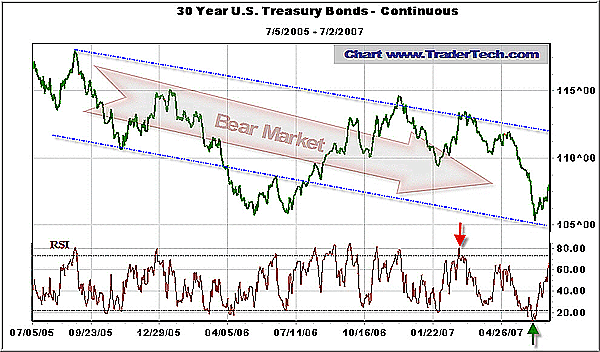
Figures 3 and 4 show short-term charts of the Spyders (SPDR) and 30-year bonds along with the seven-day relative strength index (RSI). Red arrows mark the latest sell signals and green the latest buy signals. However, taking the latest buy signal in Figure 3 for the SPDRs would have meant buying near the upper limit of the current trend channel. The buy signal for bonds was much stronger and came nearer the bottom of its trend channel as well as off the long-term trendline (in Figure 2). |
| THE BIG PICTURE A chart analysis shows stocks near a topping point and bonds just off a low. But what kind of top can we expect in stocks? Given that bonds are in a bear market, it is also likely the rally will run out of steam as bonds approach their upper trendline in Figure 4. And because stocks are in a strong rally, chances that they were at a major reversal point in July must be considered lower than the probability that this is a temporary correction. At this point, the severity of the stock correction will depend on a number of factors. Rising oil prices will take money out of consumers' pockets for consumer cyclicals and staples and have a negative impact on the economy and corporate profits. A low dollar hurts domestic companies but is good for multinationals selling their products abroad. The summer doldrums can also be a challenging time for stocks, and once they are over, September has the reputation as the worst month of the year for stocks. The good news is that we are in a preelection year, the strongest of the four-year election cycle for stocks, and November and December have been two of the best months to be long (see "Picking The Best Month To Be In The Market" in "Suggested reading"). October is usually a great time to get back in. If the future is anything like the past decade, bond traders should continue to look at stocks and stock traders to bonds for clues about which way to trade. Except now, instead of taking the same signals, they take their cues to trade in the opposite direction. |
| SUGGESTED READING Blackman, Matt [2005]. "The Market Thrivor's Secret Weapon," August 10, WorkingMoney.com. _____ [2004]. "Are Stocks and Bonds Recoupling?" February 11, WorkingMoney.com. _____ [2004]. "The Presidential Leap," July 7, WorkingMoney.com. _____. "Picking The Best Month To Be In The Market," www.electionomics.com/bestmonths2.asp Murphy, John [2004]. Intermarket Analysis, 2d ed., John Wiley & Sons. |
Matt Blackman is a full-time technical and financial writer and trader. He produces corporate and financial newsletters, and assists clients in getting published in the mainstream media. He tweets about stocks he is watching at www.twitter.com/RatioTrade Matt has earned the Chartered Market Technician (CMT) designation.
| E-mail address: | indextradermb@gmail.com |
PRINT THIS ARTICLE

Request Information From Our Sponsors
- StockCharts.com, Inc.
- Candle Patterns
- Candlestick Charting Explained
- Intermarket Technical Analysis
- John Murphy on Chart Analysis
- John Murphy's Chart Pattern Recognition
- John Murphy's Market Message
- MurphyExplainsMarketAnalysis-Intermarket Analysis
- MurphyExplainsMarketAnalysis-Visual Analysis
- StockCharts.com
- Technical Analysis of the Financial Markets
- The Visual Investor
- VectorVest, Inc.
- Executive Premier Workshop
- One-Day Options Course
- OptionsPro
- Retirement Income Workshop
- Sure-Fire Trading Systems (VectorVest, Inc.)
- Trading as a Business Workshop
- VectorVest 7 EOD
- VectorVest 7 RealTime/IntraDay
- VectorVest AutoTester
- VectorVest Educational Services
- VectorVest OnLine
- VectorVest Options Analyzer
- VectorVest ProGraphics v6.0
- VectorVest ProTrader 7
- VectorVest RealTime Derby Tool
- VectorVest Simulator
- VectorVest Variator
- VectorVest Watchdog