HOT TOPICS LIST
- Strategies
- Stocks
- Buy
- Investing
- Brokers
- Psychology
- Interviews
- Accumulate
- Sell
- Hold
- Spotlight
- Websites
- Candlestick Corner
- Gold & Metals
- Options Trading
LIST OF TOPICS
CANDLESTICK CORNER
Counting Crows
06/14/07 03:04:11 PM PSTby Sharon Yamanaka
One man's sell is another man's buy signal. Which is best?
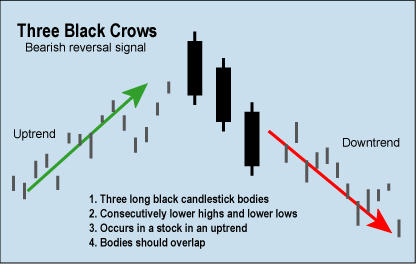
| This all started when I read Strategies For Profiting On Every Trade: Simple Lessons For Mastering The Market by Oliver Velez. In it he uses a system that locates entry points by "three or more consecutive lower highs." In addition, the targeted stock is in an uptrend and has recently made a new high. Velez wrote: "Strong stocks tend to rebound sharply after experiencing 3 to 5 consecutive down days...After a 3 to 5 bar drop, the master trader buys the very next time the stock trades above a prior bar's high." Velez's successful Pristine Trading System is based on this concept. This three-day drop is, of course, another way of defining the Japanese candlestick three-black crow formation (see sidebar "Three black crows"), but in the "ancient investment techniques of the far east," as candlestick expert Steve Nison refers to it, this formation indicates a reversal. In fact, according to various candlestick investors, it is one of the most reliable of all candlestick formations, the drawback being that it rarely occurs. From Nison's book Japanese Candlestick Charting Techniques: "If there are three declining consecutive black candles, it is called three black crows pattern. The three black crows presage lower prices if they appear at high price levels or after a mature advance... Likened to the image of a group of crows sitting ominously in a tall dead tree, the three crows have bearish implications. The three lines should close at, or near, the lows. Ideally, each of the openings should also be within the prior session's real body." Sidebar 1: So which is it? A buy or a short? Ancient Japanese wisdom or high-tech computer programming? I thought it would be easy enough to check, but I was wrong. I found it extremely difficult to find or program a good screen for three black crows. What is visually easy to find turned out to be daunting to program. I could be looking right at a three black crow formation and be unable to program MetaStock to identify it. Using code that defined large candlesticks as varyingly bigger percentages of the average trading range for the past seven to 21 days, plus an uptrend using linear regression, turned out to be too tricky for me. See sidebar "Sharon three blackcrows + linear regression." SIDEBAR 2: Staff Writer Dennis Peterson eventually created this code for three black crows for MetaStock. You can find the pattern in an uptrend using this code, although it only finds one per stock at a time. body1:=C-O; |
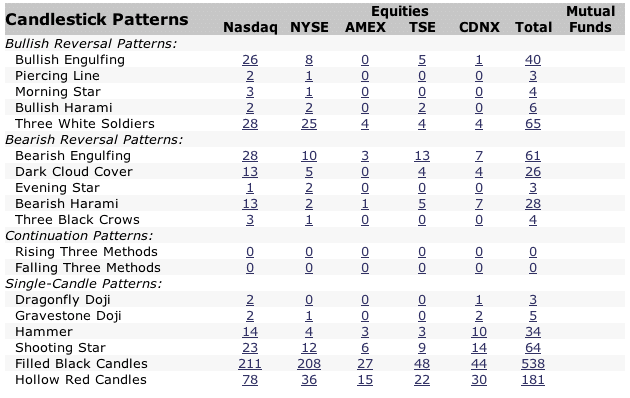
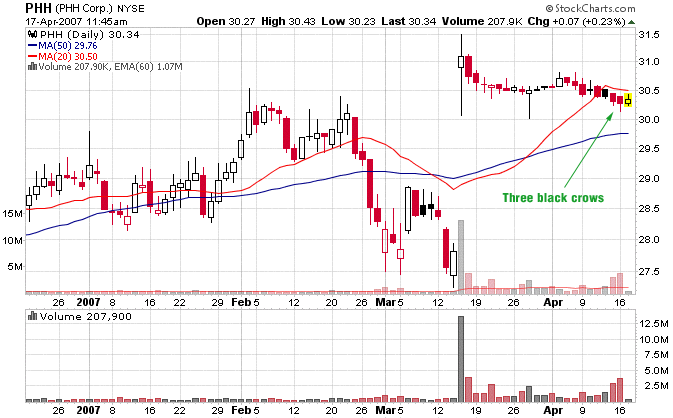
| I then consulted Tom Bulkowski, a contributing writer to Technical Analysis of STOCKS & COMMODITIES and author of Encyclopedia Of Chart Patterns, who happened to be in the midst of researching candlestick patterns. He was kind enough to share some of his results. Cautioning they were only preliminary, Bulkowski found that three black crows didn't indicate a reversal when the market indexes were in an uptrend but were significant in a downtrend. Since more black crow formations occurred in a downtrend, that made them indicative of a reversal. So I had a preliminary hypothesis. Three black crows are significant, particularly so when the market is in a downtrend. I then turned to StockCharts.com, a site that screens for candlestick formations. Greg Morris, a prominent name in candlestick methodology and author of Candlestick Charting Explained and CandlePower, developed the candlestick scans available there. On April 17, StockCharts.com found four three-black crow formations. Figure 1 shows the scan. The three under NASDAQ were penny stocks, too small for me to trade. The one under NYSE was PHH (Figure 2).
|
| Looking at Figure 2, the long body characteristic of three black crows is missing and the stock isn't in an uptrend. But it does have the three consecutive lower highs, indicating a three-day drop in the price. After going through a few more days' scans, I decided StockCharts.com had loosened their definition of a black crow pattern. I had done the same thing. Looking for stocks in an uptrend, defining "large" candlestick bodies as at least twice the 14-day average range with three consecutive falling open/closing prices, and a 10% candlestick body overlap yielded nothing over the past year on the Standard & Poor's 500. Whereas the scan modified by StockCharts.com found one or two a day per exchange, it would be useless for a website like StockCharts.com -- although not necessarily for an individual -- to have a scan that only found one likely candidate every few months. With that in mind, I went back a year and built a spreadsheet of the three black crows from their scan. METHODS
|
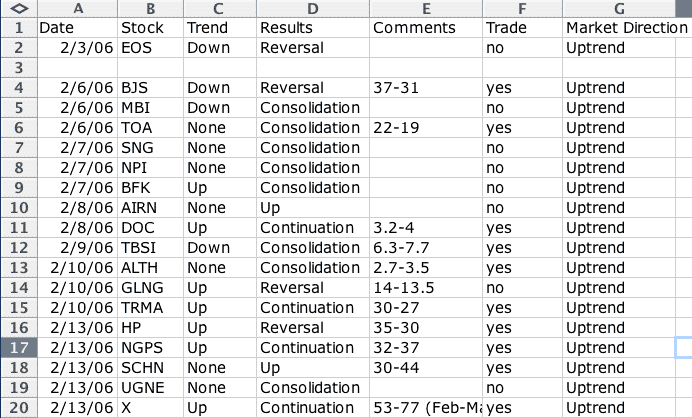
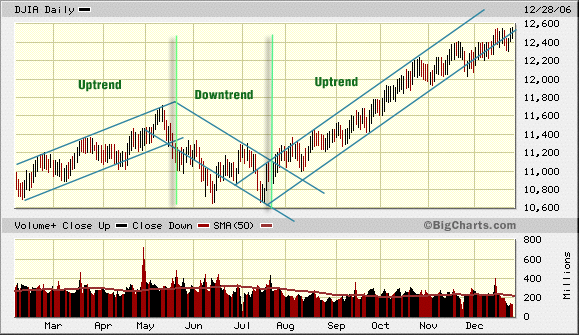
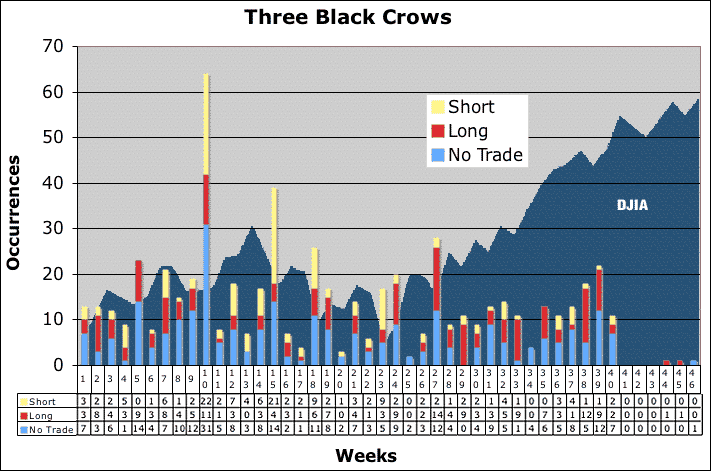
| 1. Market direction (column G). Drawing channels around the DJIA, I defined three different trends beginning with an uptrend, secondary reversal, then a resumption of the uptrend (Figure 4). I defined the dates from February 3 to May 12, 2006, as an uptrend, May 15 to July 21 as a secondary downtrend, and July 24 to December 29 as an uptrend. 2. Stock and trend. These were defined as a series of higher highs and higher lows established over a minimum period of four weeks for uptrends and the reverse for downtrends. If the stock wasn't clearly in an up- or downtrend, I rated them as "none." 3. Results. I indicated whether the stocks reversed or continued their previous trend, or consolidated two months following the black crow pattern. I gave them some leeway to establish direction. The pattern didn't have to appear at the top of a reversal. 4. Trade. I set up a 10% reward versus 5% risk trades and noted whether I would have taken the trade and whether it was long or a short. This was my version of back-testing. 5. Comments. Personally, I put in rough entry and exit points for the trades. I had no set standards for deciding entries, except on the day after the three black crow formation that they be conservative, and close to round numbers so the math would be quicker. The exits were either from the 5% trailing stop-loss or after a large gain, again arbitrary. Figure 5 shows the occurrences of three black crows by week with the DJIA in the background for comparison. The total number of occurrences are shown in the bars and broken out by results, whether the stock was shorted (yellow), bought (red), or not traded (blue). The black crows peaked just prior to the reversal in the DJIA, the DJIA then being in a mature uptrend. On the reversal, occurrences lessened until the trend reversed and broke to the upside. Another short-lived spike formed, then occurrences slowly declined. This may have been seasonal going into the year-end holidays, as well as a characteristic of a renewed uptrend.
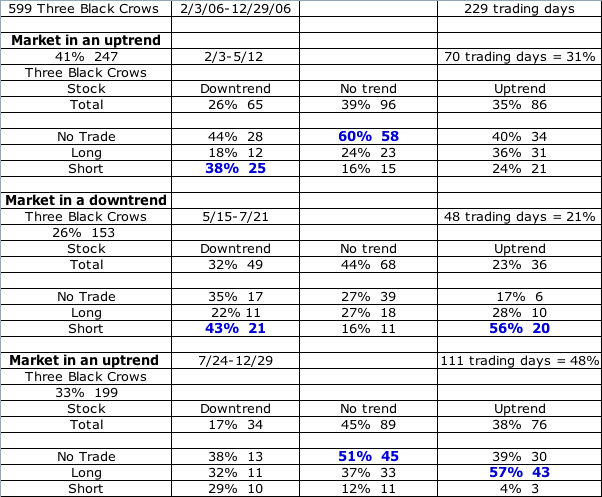
Falling stocks at the beginning of a new and powerful uptrend may be sparse. Similarly, the number of occurrences increased right before the reversal. These signals are the types expected from a momentum indicator. There were 137 total successful shorts, the majority occurring at the top of the DJIA's mature uptrend and during the downtrend, and hardly any at the beginning of the new trend. The 192 long plays showed the opposite tendencies, the highest percentage occurring at the beginning of the new trend, and the least during the downtrend. Throughout the period, the highest number of black crows, 270 out of 599, resulted in no trade, with the majority occurring in trendless stocks. By that point I believed there was a pattern to the black crow formation that seemed intuitively correct. I wanted to find out if it was predictable. I had stocks in various trends from StockCharts.com's scan but didn't know whether to short, go long, or leave them alone. I then tabulated the occurrences by trend -- cross-referencing the DJIA trend to the stock trends and tabulate the results, whether the stock rose, consolidated or fell following the black crow formation. Figure 6 shows the results.
|
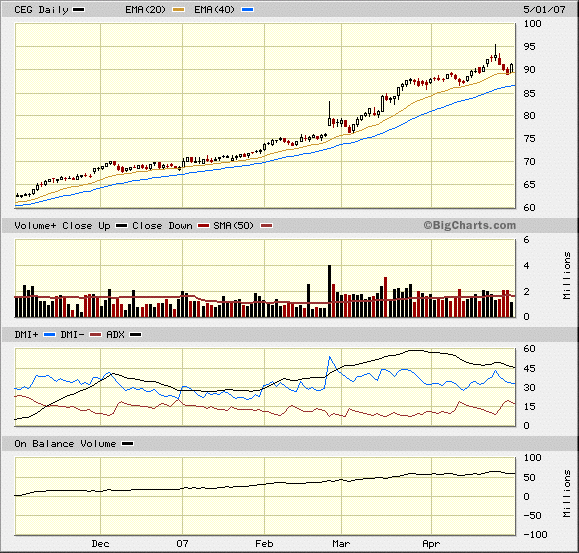
| Of winning trades, 57% occurred in stocks in an uptrend going long when the market was in an early uptrend. Shorting stocks during a downtrend when the market is in a downtrend resulted in a 56% accuracy rate. But you can't help noticing the highest percentage -- that is, 60% -- goes to no trend, no trade, no matter what the market direction. All intuitive, the results are so logical I'm ready to take this study at face value, and given the difficulty in analyzing the stocks one by one, feel that the results are usable. There was one more play worth noting -- even though the percentages of shorting success are under 50%, the gains (not shown) are considerably larger on a short than a long, again reinforcing the tenet that the market goes down faster than it goes up. Therefore, the huge jump in shorts in week 10 may have yielded good profits, or at least signaled the impending reversal and the possibility of shorting the black crow pattern. CONCLUSION There it is: High price levels or after a mature advance. The black crows found by StockCharts.com have to be put in their proper context before they're usable. If they appear at the opposite end of the spectrum -- low price levels prior to an advance -- they can be used as buys following Oliver Velez's trading strategy. Once they occur, buy in on the following day that the stock closes above the previous day's high. That is, wait until the stock stops going down before buying in. As an example of its use, on May 1, 2007, there were six black crow patterns in StockCharts.com's scan. Of those, I liked Constellation Energy Group (CEG) (Figure 7) for a long trade.
The stock was bouncing off the 20-day moving average, and the drop from the black crow pattern presented a perfect entry point. The stop would be slightly below the 20-day moving average with the target at $95. There's an immediacy and simplicity to the pattern that makes it worthwhile to review. There are a number of naysayers as well as studies on the effectiveness of Japanese candlestick patterns that take them at face value and plot gains made on the following day. Those studies find nothing significant in the patterns as the stocks have no preference for either up or down movement following their occurrences. But by placing them within a larger context, their value as an indicator becomes apparent. Far from being the Far Eastern indicator that transcends stock market analysis, the three black crows fit hand-in-glove with technical analysis methodology; you only have to know how to use them. Where have I heard that before? SUGGESTED READING |
| Title: | Staff Writer |
| Company: | Technical Analysis, Inc. |
| Address: | 4757 California AVE SW |
| Seattle, WA 98116 | |
| Phone # for sales: | 206 938 0570 |
| Fax: | 206 938 1307 |
| Website: | www.Working-Money.com |
| E-mail address: | syamanaka@traders.com |
Traders' Resource Links | |
| Charting the Stock Market: The Wyckoff Method -- Books | |
| Working-Money.com -- Online Trading Services | |
| Traders.com Advantage -- Online Trading Services | |
| Technical Analysis of Stocks & Commodities -- Publications and Newsletters | |
| Working Money, at Working-Money.com -- Publications and Newsletters | |
| Traders.com Advantage -- Publications and Newsletters | |
| Professional Traders Starter Kit -- Software | |
PRINT THIS ARTICLE

|

Request Information From Our Sponsors
- StockCharts.com, Inc.
- Candle Patterns
- Candlestick Charting Explained
- Intermarket Technical Analysis
- John Murphy on Chart Analysis
- John Murphy's Chart Pattern Recognition
- John Murphy's Market Message
- MurphyExplainsMarketAnalysis-Intermarket Analysis
- MurphyExplainsMarketAnalysis-Visual Analysis
- StockCharts.com
- Technical Analysis of the Financial Markets
- The Visual Investor
- VectorVest, Inc.
- Executive Premier Workshop
- One-Day Options Course
- OptionsPro
- Retirement Income Workshop
- Sure-Fire Trading Systems (VectorVest, Inc.)
- Trading as a Business Workshop
- VectorVest 7 EOD
- VectorVest 7 RealTime/IntraDay
- VectorVest AutoTester
- VectorVest Educational Services
- VectorVest OnLine
- VectorVest Options Analyzer
- VectorVest ProGraphics v6.0
- VectorVest ProTrader 7
- VectorVest RealTime Derby Tool
- VectorVest Simulator
- VectorVest Variator
- VectorVest Watchdog

