HOT TOPICS LIST
- Strategies
- Stocks
- Buy
- Investing
- Brokers
- Psychology
- Interviews
- Accumulate
- Sell
- Hold
- Spotlight
- Websites
- Candlestick Corner
- Gold & Metals
- Options Trading
LIST OF TOPICS
CANDLESTICK CORNER
The Belthold Signal
11/07/06 02:47:18 PM PSTby Stephen W. Bigalow
This candlestick signal will give you an idea of where you're going.
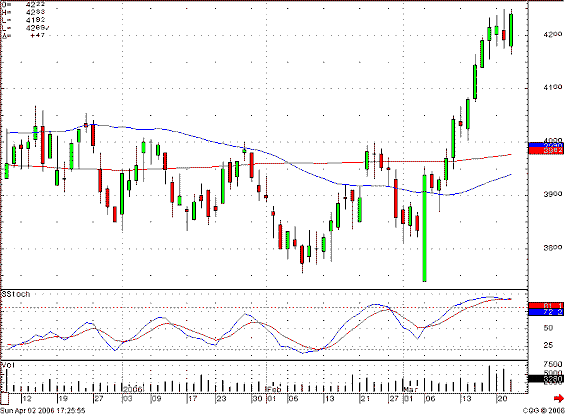
| Like the candlestick technique itself, candlestick reversal signals are the result of centuries of statistical analysis. Unlike the computer age, this statistical analysis resulted from successful utilization of recurring price signals, all by human hand and eye. In producing this reversal signals method, the 17th-century Japanese rice farmers credited with originally developing the candlestick technique also came up with a way to illustrate trend reversals with high-probability results. What could be better than knowing which way a market or trading entity will move? An additional element of the technique is knowing how strong that new move will be. This simple indicator not only helps confirm the trend reversal but also reveals whether the new trend has great force. WHAT IS THIS INDICATOR? Dissecting the implications of a belthold makes it easier to understand. Once you know why this formation occurs, taking advantage of what the belthold signal reveals becomes profitable. The ramifications of where a belthold signal occurs are an important aspect of candlestick analysis. Candlestick signals make analyzing market patterns relatively easy. Trading patterns become easily recognized because of investor sentiment. Investor decision-making is flawed with the input of emotion; human emotions are contrary to rational investment decision-making. Being able to analyze what investors normally do provides a huge advantage for the candlestick investor. Essentially, candlestick analysis is capturing and analyzing investor sentiment on a chart. Candlestick signals work effectively in all time frames, since the sentiment for each time period is clearly defined with candlestick formations. Once you recognize a trading pattern is developing, you can analyze it and time your trades more accurately. The belthold is a powerful reversal signal and a continuation pattern, and it can be recognized with a simple premise. The opening price gaps open well below the current trading area (Figure 1). Very often the buying will start almost immediately from that level and the price will start moving back up into, or very near, the previous trading area. (The bearish belthold signal has the same indication, except it gaps open at the top and comes back down into the trading range. For the purpose of illustration, all explanations here will be for the bullish belthold signal.)
|
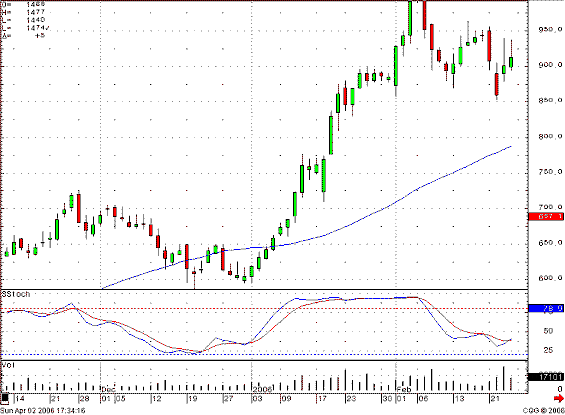
| The investment psychology incorporated into a belthold signal is easy to understand. After a sustained downtrend the sellers capitulate and want out of the position. The price gaps down well below the previous trading area. Most likely, this was the level at which the market makers could find buyers to soak up the final selling. From that point the buyers continued buying until the price came back up close to or into the previous trading area. As a bottom reversal signal, it is highly effective. It is also an informative formation for revealing when profit-taking is over in an uptrend, making it an accurate continuation signal. The Japanese term for "belthold" is yorikiri, a sumo wrestling term meaning "pushing with the body" while maintaining a grip on the opponent's mawashi, or belt. BELTHOLD SIGNAL ELEMENTS The gap down below the previous trend reveals panic selling or the sellers wanting to get out of the position as quickly as possible. If buyers step into position, the price goes right back up near the previous trading range. WHERE IS THE MOST PANIC SELLING? Understanding the ramifications of a belthold signal allows an investor to analyze other technical factors that may add to the credibility of the reversal signal. As illustrated in the chart of Bottomline Technologies in Figure 2, the belthold signal occurring at the same level as the previous bullish candlestick signal, a bullish harami, has more credibility than an uptrend will.
|
| The belthold signal occurring in the same area in which the downtrend stopped two weeks earlier indicates a double bottom could appear. The implication the belthold signal conveys — that a double bottom may be in progress — makes for an extremely high probability that the bulls are starting to take control. Figure 3, the chart of First Industrial Realty Trust, demonstrates how a belthold/bullish engulfing signal brings new life to the price trend. Whatever investor sentiment was dominating the price trend over the past few months was completely altered. The gap down in price, followed by immediate and strong buying, changed the perception of the price activity.
|
| A belthold pattern during an uptrend also provides important information. In Figure 4, the chart of Broadwing Corp., a belthold signal where profit-taking could have occurred informs the investor what is happening. The profit-taking was taken out quickly. The bulls stepped in and continued buying. This revealed the uptrend was likely to continue with excessive strength. This knowledge allowed you to maintain your position and expect to take profits at higher levels.
|
| KEEP IT SIMPLE The investor sentiment the belthold conveys makes it a valuable continuation signal. Candlestick analysis is not rocket science. It is simple investment philosophy put into a visual graphic. The 400 years of investment results have provided signal results. Candlestick signals illustrate the investor sentiment (that is, fear and greed). When it comes to investing funds, human emotions will always have the same ingredients. The candlestick signals are simply the graphic depiction of investor sentiment. Candlestick signals were not discovered and tested by computer back-testing simulations; they are the result of centuries of analyzing how human emotions affect a price trend. The signals occurring over and over at specific points in a trend reversal provide a statistically proven trading platform. If you understand how they are formed, you will understand what makes prices move. SUGGESTED READING |
Stephen W. Bigalow is an author and the principal of the www.candlestickforum.com, a website for providing information and educational material about candlestick investing.
| Website: | www.candlestickforum.com |
| E-mail address: | sbigalow@msn.com |
PRINT THIS ARTICLE

|

Request Information From Our Sponsors
- StockCharts.com, Inc.
- Candle Patterns
- Candlestick Charting Explained
- Intermarket Technical Analysis
- John Murphy on Chart Analysis
- John Murphy's Chart Pattern Recognition
- John Murphy's Market Message
- MurphyExplainsMarketAnalysis-Intermarket Analysis
- MurphyExplainsMarketAnalysis-Visual Analysis
- StockCharts.com
- Technical Analysis of the Financial Markets
- The Visual Investor
- VectorVest, Inc.
- Executive Premier Workshop
- One-Day Options Course
- OptionsPro
- Retirement Income Workshop
- Sure-Fire Trading Systems (VectorVest, Inc.)
- Trading as a Business Workshop
- VectorVest 7 EOD
- VectorVest 7 RealTime/IntraDay
- VectorVest AutoTester
- VectorVest Educational Services
- VectorVest OnLine
- VectorVest Options Analyzer
- VectorVest ProGraphics v6.0
- VectorVest ProTrader 7
- VectorVest RealTime Derby Tool
- VectorVest Simulator
- VectorVest Variator
- VectorVest Watchdog


