HOT TOPICS LIST
- Strategies
- Stocks
- Buy
- Investing
- Brokers
- Psychology
- Interviews
- Accumulate
- Sell
- Hold
- Spotlight
- Websites
- Candlestick Corner
- Gold & Metals
- Options Trading
LIST OF TOPICS
THE CHARTIST
Going Forward Using Stock Screeners
04/04/06 05:16:38 PM PSTby Sharon Yamanaka
Continuing from "Bowl Pattern Breakouts," this article uses the stock screeners available on financial websites to take another look at bowl patterns.
| Such is the world of computers that, on one hand, every possible statistic is available at the tap of a fingertip. Say you want trade triggers using the histogram of the inverse relationship of the fast and slow moving average of volume as applied to the major indexes. No problem. On the other hand, what if you want to find a simple "U"-shaped bowl pattern? That's a problem. That's a visual identification, not a statistical one, and computers need to work around that. If you own MetaStock and are comfortable with programming, the STOCKS & COMMODITIES February 2006 article "Identifying The Cup (With Or Without The Handle)" by Giorgos Siligardos gives you a mechanical identification formula for a rounding bottom. But if you don't have MetaStock, there's an easier way to find bowl patterns than searching through the daily list of 52-week highs and matching them with large volume gainers. I've been using BusinessWeek Online's Advanced Stock Screener. Its screener divides search criteria into three sections: stock, valuation, and company fundamentals, with a total of 70-odd listings. By going the indirect route, I've found that I can screen for everything else, then pull up the charts and look for the bowl or other bullish patterns. I started by screening for the two essentials: 52-week highs and increased volume. Then, to incorporate as many characteristics of the 10 best stocks for 2005 into the screener as well, I reviewed the other nine winners for additional criteria. (I discussed the top winner, NutriSystem, in my previous article.) Take a look at the sidebar for the nine: [Sidebar] Searching for common factors in last year's big winners, I found: 1. Bowl pattern. From my previous article, seven of the top 10 stocks had formed a bowl pattern that, upon completion, broke out at 52-week highs. 2. Lower-priced stocks. Taking splits into account, except for Titanium Metals (TIE), all went into 2005 with a share price of less than $10. 3. Small to micro-cap companies. Market capitalization is determined by taking the stock price and multiplying it by shares outstanding, with large-cap greater than $5 billion; mid-cap, $500 million to $5 billion; small-cap, $150 million to $500 million; and micro-cap, $50 million to $150 million. All 10 companies were either small or micro-cap at the beginning of 2005. 4. Leading sectors. Six companies fell under the sector of basic materials, with four of them in the oil and gas exploration industry. Generally, the oil and gas exploration industry does well when oil prices are up, which Morningstar defines as being above $55 per barrel. Basic materials are considered an "old-economy" sector and cyclical in nature. 5. Institutional ownership. Institutional interest can cause dramatic and sustained increases in a stock's price. All 10 of the stocks had institutional buying. Although a couple of them didn't see large increases, none decreased, and Nutrisystem (NTRI), the top stock, had institutional ownership increase from zero to 68%. From the top 10 list, I tried to incorporate market cap, institutional ownership, and a few key fundamentals into my stock screen. When I first began working with the Advanced Stock Screener, I found if I put in too many criteria, say over 10, the screener found no stocks, and gave an automated message of "Request was limited too severely by ABSOLUTE criteria." I eventually narrowed my search down to the following variables. Under stocks, I put in: |
| The next section, valuation, didn't apply to bowl patterns: the idea of looking for beaten-up, undervalued stocks was the opposite of momentum trading, so I skipped it. For fundamentals, I used the following:
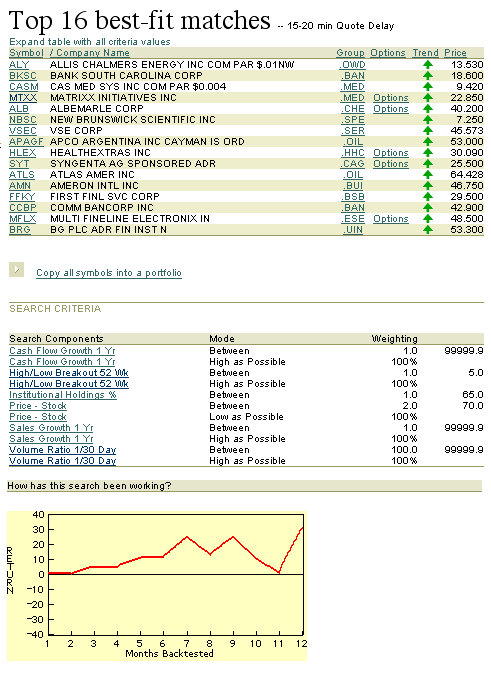
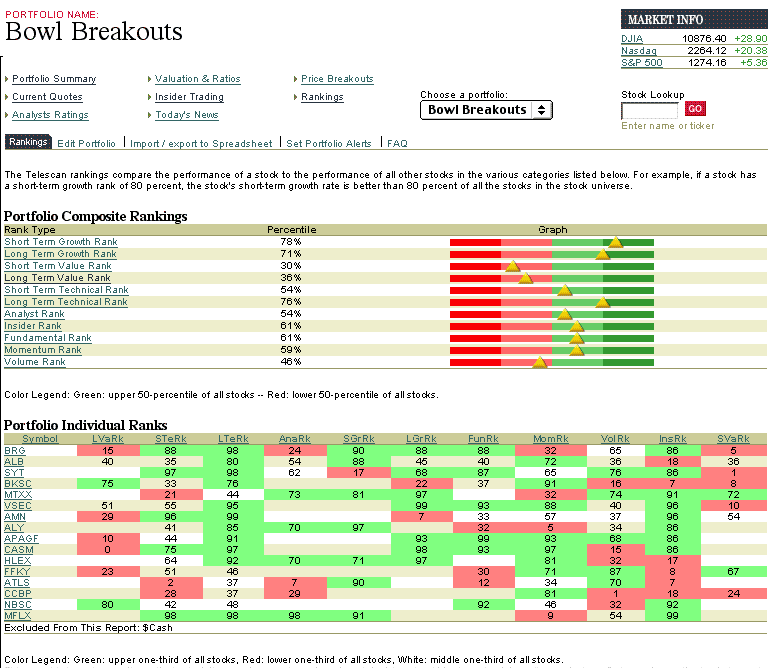
Figure 1: Top 16 best-fit matches. Allis Chalmers came out on top when a search using fundamentals as a factor was used. This search yielded 16 stocks with Allis Chalmers Energy (ALY) at the top. You can see my results in Figure 1. In the Advanced Stock Search's report, note the "Copy all symbols into a portfolio" link. It will analyze any portfolio you create from many different angles. Think of "Thirteen Ways of Looking at a Blackbird." Or is that more than one way to skin a cat? Either way, it will evaluate and rank your portfolio based on analyst ratings, valuation and ratios, price breakouts, to insider trading and overall rankings. Figure 2 shows the bowl breakout's composite evaluation. And of course, you also get headlines of current news and quotes.
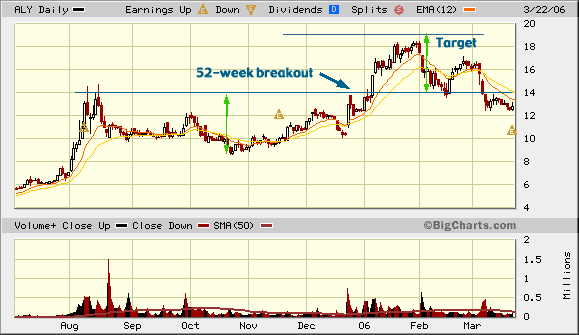
Figure 2: Bowl breakouts. Here's the composite evaluation of the bowl breakout. From there, I looked up the 16 stocks. I happened to use StockCharts.com's CandleGlance to do this because I could put in 10 stocks at a time. I found a few bowl patterns, but liked ALY the best (Figure 3). ALY had volume confirming the pattern, and I'd buy if it opened up higher the next day, confirming the breakout (Figure 4).
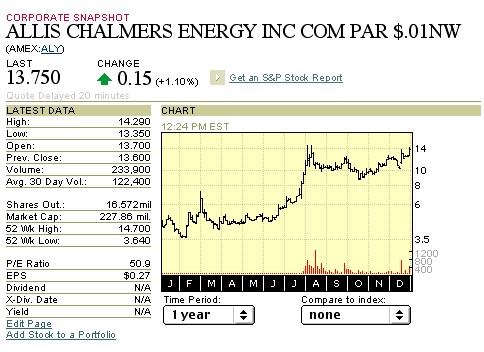
Figure 3: Allis Chalmers Energy. Of the bowl patterns that were revealed, ALY appeared to be the most promising. ALY rose as expected but fell short of my projected target of $19, so I exited with an ever-tightening 3% trailing stop on the decline at $17.95 for a 28% gain. Since then, the stock has fallen to support at $13. Note the quickness of the reversal. On the initial drop, the stock lost $2, or more than 10%, in as many days, and on the second correction even more. Currently, analyst ratings show ALY to be a strong buy, but there is a lot of insider selling. Using another source, I've read that institutional buying has declined, having peaked at 40% in January and down to 27% in February, so I'm leaving this stock alone for now. The diversified machinery sector is currently out of favor.
Figure 4: ALY, Daily. Allis Chalmers had volume confirming the pattern, making it a good candidate for purchase. |
| REFINING THE SCREEN After backtesting and refining the screen, I found that by changing the fundamental and value criteria by only one parameter, either the absolutes or leaving off or including different combinations, I would often get an almost completely different list of potential stock watch candidates. This was easy to do because I had to reenter all the criteria every time I used the screen anyway; in the free section, BusinessWeek doesn't store information. My current criteria are as follows: Fundamentals: This gives me fewer results, with some higher-priced stocks now making the list. This group seems to have better fundamentals and hopefully more room to the upside before becoming overbought. BEWARE THE FIBONACCI RETRACEMENT These stocks with bowl pattern breakouts are great to own, not too hard to find, but they tend to be highly volatile micro-cap companies. The bowl pattern can sometimes break out with explosive upward momentum, followed with just as deflating a reversal. Beware the Fibonacci retracement on high-beta stocks! Often, profit-taking will cause a reversal of the stock price in the neighborhood of a one-third to 50% loss. Fibonacci retracements are based on a mathematical number series, the discovery of which is attributed to a 13th-century mathematician named Leonardo de Pisa. Referred to as the "Golden Mean," the series predicts natural number sequences at one-third and 50% ratios. For some reason, these percentages often apply to stock movement, especially when they coincide with already established support/resistance areas. As I noted with ALY, these reversals tend to occur quickly. This may be because, unlike other bullish patterns such as the ascending triangle or cup with handle, the stock rises from the bowl pattern and breaks out on the first try, rising exponentially until it runs out of steam. For me, this is one of the trickier patterns to trade. You have to constantly watch the stock and be fully prepared before buying in. Any number of analogies come to mind, but the most vivid is when I used to go dock fishing off the wharf. Every now and then I'd hook a salmon, and after a long fight, playing the fish to keep my line from breaking and getting tangled in the pilings, I'd finally get it to the dock and try to reel it in. Without a net, the sheer weight of the fish as I reeled it up the 20-odd feet out of the water would pull the hook loose, and I'd watch a nice 15-pound salmon swim away. (Of course, if you're bottom-fishing and you hook a salmon, it's going to get away.) And with that in mind, good luck, take care. Check your gear and don't forget your net. |
Sharon Yamanaka may be reached at SYamanaka@Traders.com. SUGGESTED READING Siligardos, Giorgos [2006]. "Identifying The Cup (With Or Without The Handle)," Technical Analysis of STOCKS & COMMODITIES, Volume 24: February. Yamanaka, Sharon [2006]. "Bowl Pattern Breakouts," Working-Money.com, February 17. Current and past articles from Working Money, The Investors' Magazine, can be found at Working-Money.com. |
SIDEBAR: THE OTHER NINE STOCKS AND THEIR STORIES I followed the trail of news releases and earnings reports that sparked the rise in these stocks.
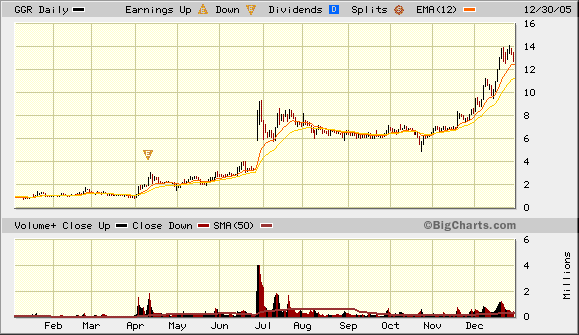
chart credit: BigCharts.com GeoGlobal Resources (GGR, sidebar Figure 1) 52-week range: 2.66-44.14 This stock doubled from $2 to $4 per share at the beginning of 2005, before the company announced on June 28 that it had discovered natural gas in India. The stock gapped up and then traded sideways until December 8, when it completed a bowl pattern at $4 and reached a 52-week high on large volume. GGR is 55% held by insiders.
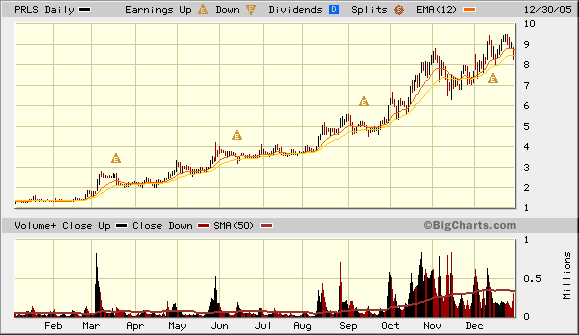
Peerless Systems (PRLS, sidebar Figure 2) 52-week range: 1.00-9.46 Here's a large bowl pattern formation that began in January 2004 and completed in May 2005. A breakout on high volume occurred three days after the 52-week high was reached in May. PRLS is an imaging and network technology company, selling to manufacturers of color, monochrome, and multifunction office products and digital appliances (color copiers, toner, scanners). Their stock rose after reporting second-quarter earnings of 6 cents a share compared to a loss of 9 cents a share a year ago. In 2005, they signed a deal with Kyocera-Mita for $24 million. They continued to beat analyst estimates for the remainder of the year.
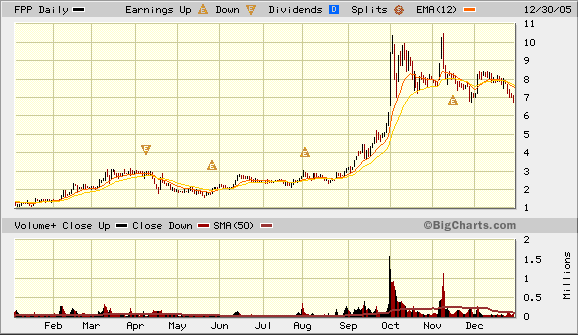
Fieldpoint Petroleum Corp. (FFP, sidebar Figure 3) 52-week range: 1.09-10.50 Fieldpoint announced on September 9, 2005, that "total drilling depth of the Mercury Fee #1 has been reached..." and they were going to begin laying down pipe. At that point, their stock completed a bowl pattern and broke out to a new 52-week high. The stock continued up from the $3 breakout to $5. Upon breaking the $5 barrier, the stock shot up on high volume, exceeding $10 before consolidating at $8. An independent oil and gas exploration company, FFP operates 61 wells. This sector does extremely well when crude oil prices are high as they were in 2005. Also of note, chairman and CEO Ray Reaves, an oil and gas industry veteran, controls 41% of the company.
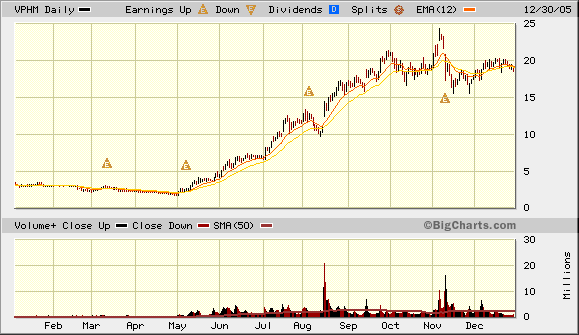
ViroPharma Inc. (VPHM, sidebar Figure 4) 52-week range: 1.67-24.36 VPHM was trading in a flat-line pattern before it acquired the drug Vancocin, a colitis treatment, in May 2005. Piper Jaffray then initated coverage of the company, rating it as "outperform." "We believe Vancocin will allow ViroPharma to be cash flow positive in 2006," opined Piper Jaffray analyst Thomas Wei. On August 16, 2005, shares rose another 26% on the announcement of a price increase in Vancocin. Shares then fell in November, from the $24 range to $16, on the news that several drug companies were creating generics of the drug.
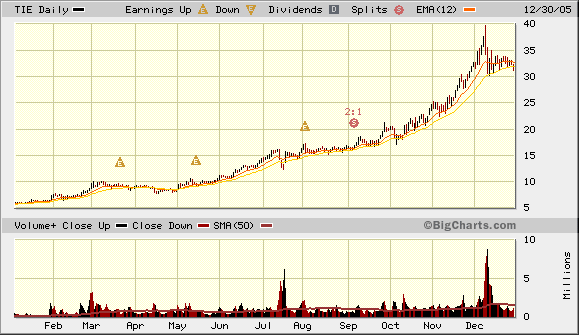
Titanium Metals Corp. (TIE, sidebar Figure 5) 52-week range: 11.095-79.44 Titanium Metals had been in a two-year uptrend, hitting 80 before consolidating between 60-70. In mid-2004, the company began turning a profit based on demand by the aerospace and defense industries for titanium, it being a lighter, stronger metal than what was previously used. This trend continued through 2005. TIE is part of industrial materials, a classic old-economy sector that is cyclical in nature. TIE seems to be particularly vulnerable, however, having gone through a reverse 1:10 split post-9/11, and partially undoing the reverse with a 5:1 split in September 2004 as the company became profitable again. At the end of 2005, TIE's quaterly revenue growth was 58%, ROE 28.69, and ROA 9.99%.
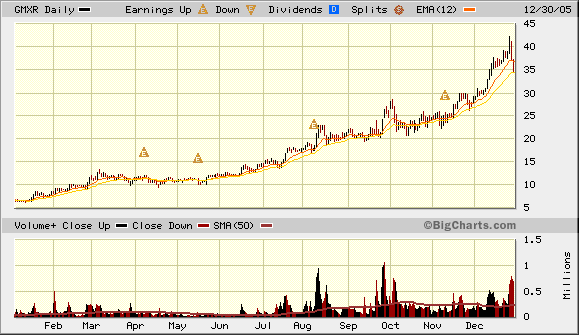
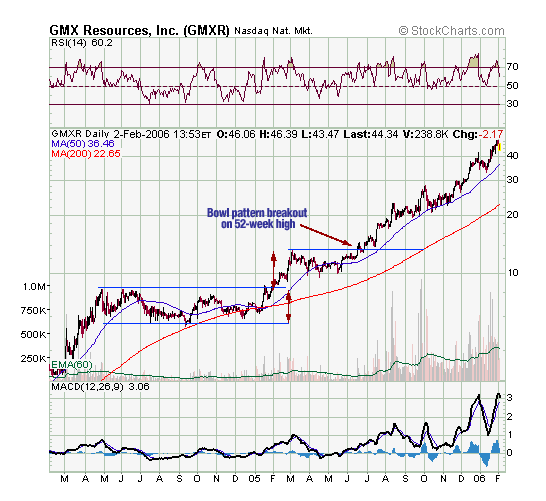
GMX Resources (GMXR, sidebar Figure 6) 52-week range: 6.22-37.80 With a market cap of $364.24 million, this small, up-and-coming company was in one of the strongest sectors of 2005. The two-year chart shown in sidebar Figure 7 shows the increased volume on the 52-week breakout and completion of a bowl pattern in mid-June. A bullish broker's comment sums it up: "Undervalued, low risk, US drilling sites." Along with their production and sales, oil and gas prices increased as well. As a small, profitable company, it has been the subject of takeover rumors.
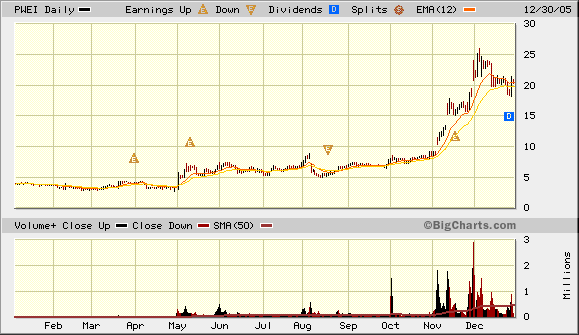
PW Eagle, Inc. (PWEI, sidebar Figure 8) 52-week range: 2.73-25.95 Unlike the other stocks on this list, PWEI traded flat for most of 2005, taking off in the beginning of November on third-quarter earnings that showed a profit along with the rest of the market. All boats float with a rising tide, and in November, the Dow Jones Industrial Average (DJIA) rose about 8%, taking PWEI with it. PW Eagle's third-quarter results saw the company turn a profit, and the stock rose on high volume, gapping up to $10, then peaking in the beginning of December at $26.25. Going back to the middle of the year, the gap up in May was on PWEI's first-quarter earnings report in May when they first showed a positive net income. PW Eagle offers PVC pipe and fittings for applications in the building, municipal water distribution, municipal sewage collection, turf and agriculture irrigation, fiber-optic, power distribution, and telecommunications industries. Also of note, in October they acquired/merged with rival US Poly. Belongs to the commodity chemical cyclical sector. Higher sales plus merger equal a turnaround company.
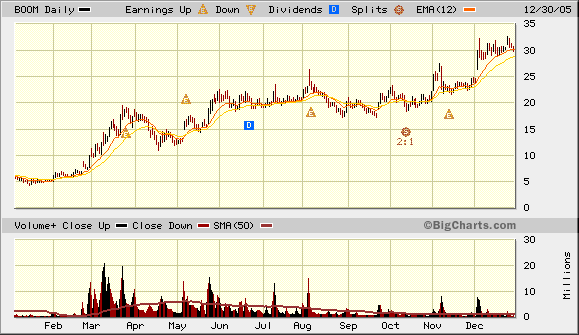
Dynamic Materials Co. (BOOM, sidebar Figure 9) 52-week range: 4.325-32.18 Another bowl pattern breakout with the pattern starting in November 2003, when the company changed their board of directors and posted earnings up 24%. The bowl pattern completed at the end of February 2005 on the release of their fourth-quarter earnings, with profits up a whopping 126%. The stock was highly traded in March, adjusting for splits, going from $5 to $20 before and falling by 40% in April when it failed to meet analyst estimates. It eventually recovered and rose from $20 to $30 at the tail end of the year. Dynamic Materials is an international company based in Colorado. They operate an explosive metalworking group and own AMK Welding. Sales and profits were up based on demand for explosives used in oil exploration and drilling needs.
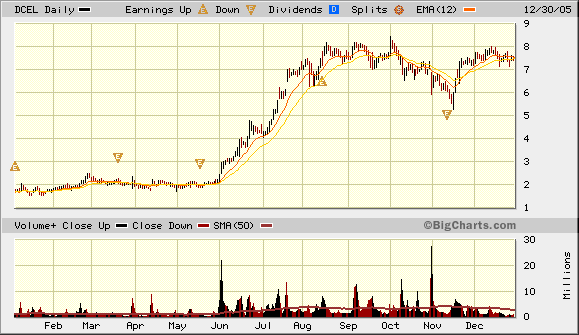
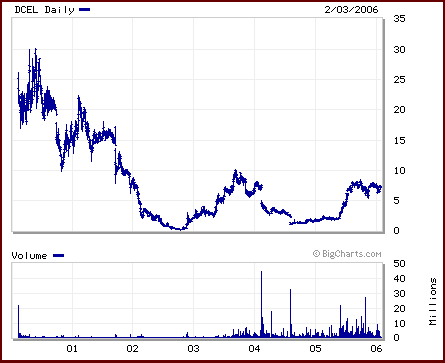
Dobson Communications Corp. (DCEL, sidebar Figure 10) 52-week range: 1.46-8.47 This is a story about which slice of the pie you are viewing. Looking at Dobson's chart for 2005, it looks as if the other nine stocks on the list suddenly took off during the year. Going back a few years (sidebar Figure 11) shows a larger picture of the company recovering from a two-year double bottom.
|
| Title: | Staff Writer |
| Company: | Technical Analysis, Inc. |
| Address: | 4757 California AVE SW |
| Seattle, WA 98116 | |
| Phone # for sales: | 206 938 0570 |
| Fax: | 206 938 1307 |
| Website: | www.Working-Money.com |
| E-mail address: | syamanaka@traders.com |
Traders' Resource Links | |
| Charting the Stock Market: The Wyckoff Method -- Books | |
| Working-Money.com -- Online Trading Services | |
| Traders.com Advantage -- Online Trading Services | |
| Technical Analysis of Stocks & Commodities -- Publications and Newsletters | |
| Working Money, at Working-Money.com -- Publications and Newsletters | |
| Traders.com Advantage -- Publications and Newsletters | |
| Professional Traders Starter Kit -- Software | |
PRINT THIS ARTICLE

|

Request Information From Our Sponsors
- StockCharts.com, Inc.
- Candle Patterns
- Candlestick Charting Explained
- Intermarket Technical Analysis
- John Murphy on Chart Analysis
- John Murphy's Chart Pattern Recognition
- John Murphy's Market Message
- MurphyExplainsMarketAnalysis-Intermarket Analysis
- MurphyExplainsMarketAnalysis-Visual Analysis
- StockCharts.com
- Technical Analysis of the Financial Markets
- The Visual Investor
- VectorVest, Inc.
- Executive Premier Workshop
- One-Day Options Course
- OptionsPro
- Retirement Income Workshop
- Sure-Fire Trading Systems (VectorVest, Inc.)
- Trading as a Business Workshop
- VectorVest 7 EOD
- VectorVest 7 RealTime/IntraDay
- VectorVest AutoTester
- VectorVest Educational Services
- VectorVest OnLine
- VectorVest Options Analyzer
- VectorVest ProGraphics v6.0
- VectorVest ProTrader 7
- VectorVest RealTime Derby Tool
- VectorVest Simulator
- VectorVest Variator
- VectorVest Watchdog

