HOT TOPICS LIST
- Strategies
- Stocks
- Buy
- Investing
- Brokers
- Psychology
- Interviews
- Accumulate
- Sell
- Hold
- Spotlight
- Websites
- Candlestick Corner
- Gold & Metals
- Options Trading
LIST OF TOPICS
CANDLESTICK CORNER
Color The Doji Amber
12/28/05 02:34:38 PM PSTby Rudy Teseo
In candlesticks or bar charts, the Japanese have a saying: "When you see a doji, take notice."
| The doji is a warning, and like all warnings, it should be paid the respect it deserves. The doji is probably the single most important candlestick pattern. It is the only pattern that is complete in itself: all other significant patterns consist of two or three candles. (The doji may be part of a multibar pattern, however.) It is unique in that it is the only candlestick pattern that is the same pattern in bar charts. However, many chartists, not having studied candlesticks, may not be aware of its significance. WHAT IT IS
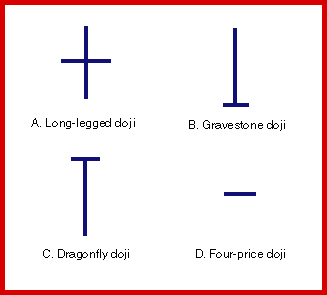
Figure 1: DIFFERENT DOJI. Here are several doji patterns. The first is a long-logged doji if the open and close are in the middle of the day's trading range. The gravestone doji is a bearish signal, and if it appears at the market top, the pattern is significant for a reversal. The dragonfly doji is the opposite of a gravestone and if it appears at a market bottom, it is extremely bullish. The four-price doji is rare, and could be caused by a data error or missing data; it can confirm total uncertainty in the marketplace.
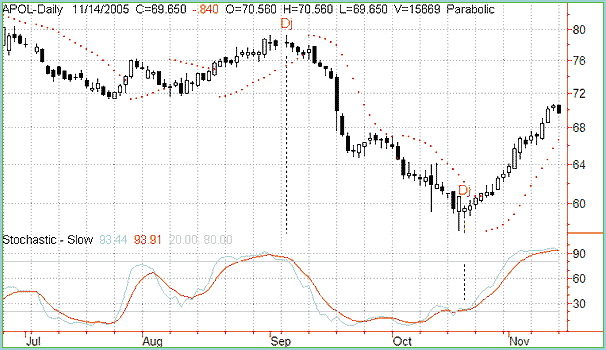
Pattern A is a perfect or textbook doji. After the opening, the bulls tried to push the market up, but the bears managed to push it back down to the opening price, or vice versa. If the open and close are in the middle of the day's trading range, the pattern is referred to as a long-legged doji. Pattern B is a gravestone doji, a bearish signal. The bulls were not able to sustain the higher price that they moved up from the opening, and prices were pushed back to the opening level to close at the low of the day. If it appears at a market top, this pattern is especially significant for a reversal. Pattern C is a dragonfly doji. The opposite of the gravestone, this is a bullish pattern showing that the bears were unable to maintain the lower price that they moved down from the opening. When it appears at a market bottom, this is extremely bullish. Pattern D is a four-price doji. This pattern is rare. It could be caused by a data error or missing data. However, if the open-high-low-close (OHLC) data is present and all are equal, this pattern confirms total uncertainty in the marketplace. Some programs allow a tolerance to be applied to the doji for example, a 5% spread between the open and close. If the open and close are within this tolerance, the pattern is considered a doji, even though there are two horizontal lines instead of one, and the space between them may be solid or open (green or red, and so forth). In Candlestick Charting Explained, technician Gregory Morris explains that requiring the open and the close to be exactly equal would place too great a constraint on the data, and as a result, and we would have very few doji. ITS SIGNIFICANCE Another combination with high confidence is a doji occurring at the top of an uptrend accompanied by a stochastic in the overbought area about to pierce the threshold downward. Many technicians consider this to be an immediate sell signal. However, a doji occurring at the bottom of a downtrend accompanied by a stochastic oversold signal should have some other buy signal the next day for confirmation. One of my favorite indicators in my charts and my trading systems is the parabolic (stop and reverse (SAR)). I look for doji near the top or bottom of a range where the SAR is approaching the price in an imminent reversal. Following are some charts showing the accuracy of these occurrences: Figure 2 is a chart of APOL showing both up and down confirmations. In September, the occurrence of the doji at the top of an uptrend and the stochastic reversal from an overbought condition appeared simultaneously. Again, in October, the doji and the stochastic reversal from an oversold condition occurred simultaneously. The stochastic reversal is noted by the %K (blue) crossing the 80 or 20 thresholds. (My doji are not perfect crosses, as I have my program set so an open and close within two points of each other are considered a doji.)
Figure 2: APOL, DAILY. This chart shows both up and down confirmations.
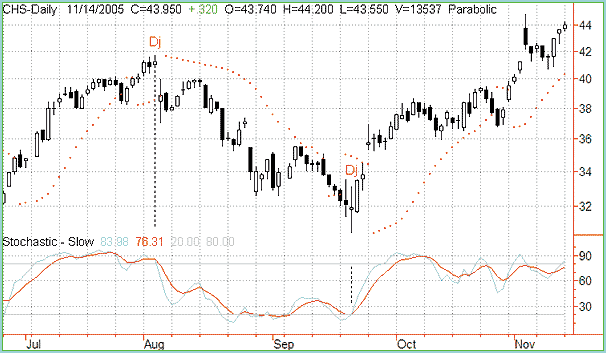
Figure 3 shows CHS with almost the same patterns as APOL. In August, the doji coincided with the stochastic reversal from the overbought area through the 80 threshold. In September, the doji coincided with the stochastic reversal from an oversold condition through the 20 threshold. All of these reversals were followed by a nice run.
Figure 3: CHS, DAILY. This chart shows almost the same patterns as APOL; these reversals are followed by a nice run.
If you had not heeded these patterns, the sharp reversal of the parabolic (stop and reverse) within a few days of the doji would have advised you to switch your bull/bear hat.
Rudy Teseo is a private stock and currency trader, and has taught classes in option trading and the basics of stock charting. He can be reached at rftess@juno.com. REFERENCES Current and past articles from Working Money, The Investors' Magazine, can be found at Working-Money.com.
|
Rudy Teseo is a private investor who trades stocks, options, and currencies. He has taught classes in technical analysis and option trading. He may be reached at rftess@optonline.net.
| E-mail address: | rftess@optonline.net |
PRINT THIS ARTICLE

|

Request Information From Our Sponsors
- VectorVest, Inc.
- Executive Premier Workshop
- One-Day Options Course
- OptionsPro
- Retirement Income Workshop
- Sure-Fire Trading Systems (VectorVest, Inc.)
- Trading as a Business Workshop
- VectorVest 7 EOD
- VectorVest 7 RealTime/IntraDay
- VectorVest AutoTester
- VectorVest Educational Services
- VectorVest OnLine
- VectorVest Options Analyzer
- VectorVest ProGraphics v6.0
- VectorVest ProTrader 7
- VectorVest RealTime Derby Tool
- VectorVest Simulator
- VectorVest Variator
- VectorVest Watchdog
- StockCharts.com, Inc.
- Candle Patterns
- Candlestick Charting Explained
- Intermarket Technical Analysis
- John Murphy on Chart Analysis
- John Murphy's Chart Pattern Recognition
- John Murphy's Market Message
- MurphyExplainsMarketAnalysis-Intermarket Analysis
- MurphyExplainsMarketAnalysis-Visual Analysis
- StockCharts.com
- Technical Analysis of the Financial Markets
- The Visual Investor


