HOT TOPICS LIST
- Strategies
- Stocks
- Buy
- Investing
- Brokers
- Psychology
- Interviews
- Accumulate
- Sell
- Hold
- Spotlight
- Websites
- Candlestick Corner
- Gold & Metals
- Options Trading
LIST OF TOPICS
CANDLESTICK CORNER
Trend Analysis Made Easy With Candlestick Signals
10/27/05 04:11:41 PM PSTby Stephen W. Bigalow
What are candlesticks telling you? Candlestick signals can identify price reversals, producing simple methods to analyze market trends and doing so accurately.
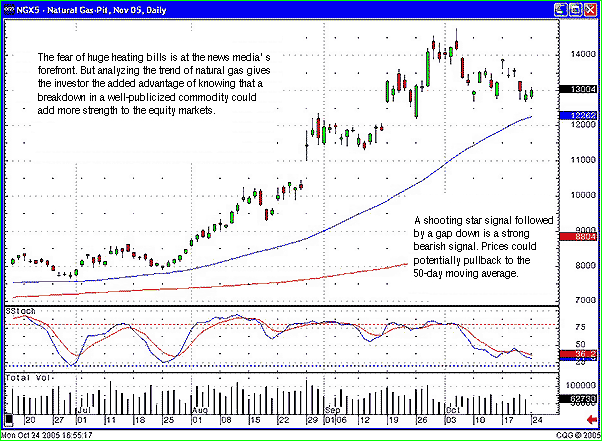
| The main purpose of technical analysis is to visually evaluate chart patterns to identify high-profit situations. Candlestick signals provide the ultimate technical analysis tools for identifying price reversals, using simple methods to analyze market trends with a high degree of accuracy. Where other technical tools provide a format for anticipating what might be a price reversal area, candlestick signals provide the information that demonstrates exactly what is going on at those levels. Using candlestick signals with other technical indicators dramatically enhances trend analysis capabilities. ANALYZE THE TREND Natural Gas: For the past two months, crude oil prices have been the main concern. High gasoline prices were slated to be a big damper on the US economy, and the media has reminded us of that fact over and over. Now a new fear is brought forth into the winter of 2005: natural gas prices! After the prices skyrocket, heating homes through a cold winter is going to deplete the American family's budget. The media has targeted the next fear factor, and knowing that, the ability to analyze the price trends of other trading entities that may cause positive or negative sentiment in the equities market becomes a valuable technical tool. For example, if high natural gas prices are expected to be a damper on the equity markets, then quickly projecting the trend of natural gas prices provides valuable information. Analyzing what the stock markets might be doing will be better accomplished if investors are able to identify where natural gas prices may go over the next few weeks. Because they are a reflection of market sentiment, candlestick signals can be used to analyze any trading entity that involves fear and greed. As you can see in Figure 1, despite the recent uptrend in natural gas prices, a shooting star formation followed by a gap down indicates that prices could pull back.
Figure 1: The Trend In Natural Gas. Although natural gas has been trending up, a shooting star formation followed by a gap down is an indication that prices could pull back.
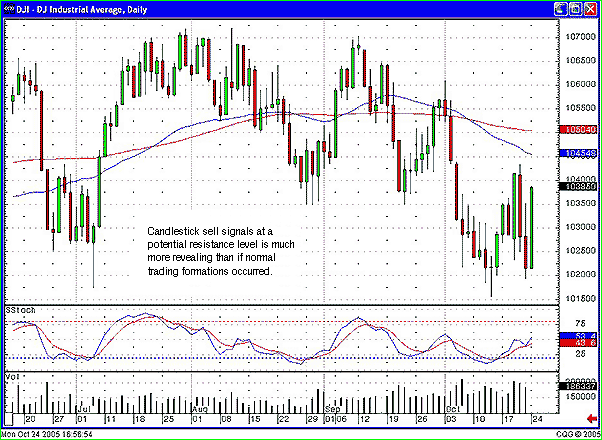
The Dow Jones Industrial Average (Djia): Candlestick signals provide the ability to witness what a trend might be doing at important technical levels. As can be seen in the Djia chart in Figure 2, the bullish harami stopped the downtrend right at the previous lows of late August. Stochastics were in the oversold area and curling back up. What would have been the logical target? The 10,700 level seemed to be the resistance area, creating a trend channel.
Figure 2: Reversal Signals. Here, you can see that a small hanging man formation followed by a bearish engulfing signal indicates a reversal in trend.
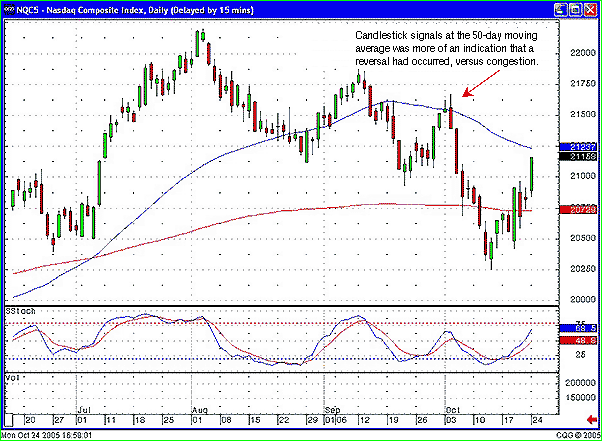
Despite that logic, the moving averages were the first target. Prior to reaching the level of the moving averages, the trend channel may have been evaluated as a possible congestion area. Viewing the moving averages back through mid-August, you can see some congestion at those levels, but the trend eventually moved through them. By analyzing the candlestick signals in this situation, the investor can see what is occurring when the moving averages are tested. In the case of the DJIA, a small hanging man signal was followed by a bearish engulfing signal. These were reversal signals, implying there could have been some selling or congestion on the part of the moving averages where the formations were not actual signals. The fact that candlestick sell signals formed at these levels provides a completely different set of analysis. The expectation of a reversal at the moving average becomes that much more anticipated than if nonsignal selling days occurred at the moving averages. Nasdaq: A similar situation can be seen in NASDAQ. As NASDAQ came back up to the 50-day moving average, it formed a shooting star (Figure 3). Not only was this a potential sell signal, but gapping up slightly and then forming a candlestick sell signal further forewarned that the 50-day moving average was going to act as resistance. This was confirmed the following day with a bearish engulfing signal.
Figure 3: A CLEAR REVERSAL. A shooting star was enough to indicate that the 50-day moving average would act as a resistance level.
Although the stochastics had not reached the overbought area, the analysis must take into consideration that the candlestick signals are the predominant analytical tool. When a sell signal occurs right at a major technical level such as a moving average, those factors should override the conditions of the stochastics. CANDLESTICKS LIGHT THE WAY Learning how to evaluate what the candlestick signals are telling you can provide huge profits for investment accounts. Being able to apply what candlestick signals are revealing at important technical levels enhances the probabilities of being in the right position at the right time. There are approximately 50 to 60 candlestick signals, and although it's not necessary to know all of them, it may help to keep a list of some of the more common ones in front of you. These signals are simple to use and provide an immense amount of information.
Stephen W. Bigalow is author of Profitable Candlestick Investing and Pinpointing Market Turns To Maximize Profits, and principal of www.candlestickforum.com, providing information and educational material about Japanese candlestick investing. Through his consulting with major trading firms, Bigalow has developed multiple successful trading programs for his hedge fund investing as well as for the daytrader to the long-term hold investor.
Current and past articles from Working Money, The Investors' Magazine, can be found at Working-Money.com.
|
Stephen W. Bigalow is an author and the principal of the www.candlestickforum.com, a website for providing information and educational material about candlestick investing.
| Website: | www.candlestickforum.com |
| E-mail address: | sbigalow@msn.com |
PRINT THIS ARTICLE

|

Request Information From Our Sponsors
- StockCharts.com, Inc.
- Candle Patterns
- Candlestick Charting Explained
- Intermarket Technical Analysis
- John Murphy on Chart Analysis
- John Murphy's Chart Pattern Recognition
- John Murphy's Market Message
- MurphyExplainsMarketAnalysis-Intermarket Analysis
- MurphyExplainsMarketAnalysis-Visual Analysis
- StockCharts.com
- Technical Analysis of the Financial Markets
- The Visual Investor
- VectorVest, Inc.
- Executive Premier Workshop
- One-Day Options Course
- OptionsPro
- Retirement Income Workshop
- Sure-Fire Trading Systems (VectorVest, Inc.)
- Trading as a Business Workshop
- VectorVest 7 EOD
- VectorVest 7 RealTime/IntraDay
- VectorVest AutoTester
- VectorVest Educational Services
- VectorVest OnLine
- VectorVest Options Analyzer
- VectorVest ProGraphics v6.0
- VectorVest ProTrader 7
- VectorVest RealTime Derby Tool
- VectorVest Simulator
- VectorVest Variator
- VectorVest Watchdog


