HOT TOPICS LIST
- Strategies
- Stocks
- Buy
- Investing
- Brokers
- Psychology
- Interviews
- Accumulate
- Sell
- Hold
- Spotlight
- Websites
- Candlestick Corner
- Gold & Metals
- Options Trading
LIST OF TOPICS
CANDLESTICK CORNER
Don't Fight The Candlesticks
09/29/05 11:28:11 AM PSTby Stephen W. Bigalow
Here's a simple process using candlestick signals.
| When is it time to buy? Usually when there is panic in the streets! However, most investors cannot get past the emotional hurdles of buying at the bottom or selling at the top. Japanese traders have a saying: "Let the market tell you what the market is going to do." In that tradition, candlestick signals hold an immense amount of information in their formations, and can help traders hear what the markets are saying. Centuries ago, Japanese rice traders made their fortunes by recognizing recurring patterns in investor sentiment. Found in the formations of candlestick signals, these same signals continue to produce profits, and — after hundreds of years of refinement — have proved to be as accurate for defining the time to buy as they are for showing the time to sell.
BUY LOW, SELL HIGH No matter what you hear about potential price moves, candlestick signals circumvent all that noise. They will tell you exactly what investor sentiment is doing now, making it relatively easy to analyze the direction of the markets and stock price trends. Consequently, using major candlestick signals can immensely increase your profits.
INVESTOR SENTIMENT/FEAR FACTOR After the onset of greed, fear is the next factor to influence an investor's decision about when to buy or sell. Of course, the biggest fear is selling out too early. Investors usually have a hard enough time identifying profitable trades, and they never want to sell out too early. Who wouldn't be upset to sell a stock at $20 and then watch it hit $30? That fear causes investors to hold onto a position well past the time it should have been sold, sacrificing a good portion of the profits.
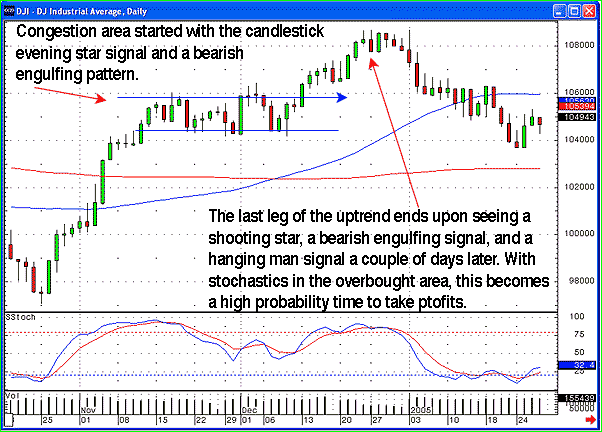
PROFIT PROBABILITY Candlestick analysis eliminates that dilemma. Hundreds of years of refinement defines "high-probability" sell signals and provides a format for establishing buys and sells. The critical word here is "probability"; buying a position using a candlestick buy signal gives the investor a high probability of executing a profitable trade. Likewise, by selling a position using candlestick sell signals, an investor creates a high probability of trading near the optimal sell areas. Does that mean every buy or sell signal is going to work the way you want it to? Definitely not! But buy signals do get the candlestick investor into positions with great probability of profit. They also allow the investor to close out trades that aren't working immediately, cutting their losses short. As for the candlestick sell signals, every one may not indicate the absolute top of a trend, but each one does provide a format indicating the very high probability that a top is near. Remember: The point of investing is not to maximize your profits on each trade. The point of investing is to maximize your profits in your account. That said, there is nothing wrong with buying or selling a position when the probabilities say it's time to buy or sell and then reopening or reclosing your position later — even at a higher price — when the signals indicate that buyers or sellers are getting back in. When the candlestick signals indicate that the probabilities are not in your favor, why fight it? The Dow Jones Industrial Average (DJIA) chart in Figure 1 is a good example of reading the signals to buy back a position. As you can see, the bullish trend from late October into mid-November started to reveal candlestick sell signals: an evening star signal, a bearish engulfing signal, and a few dojis. This congestion area became an opportune time to take profits in some of the stock charts that had moved up and were getting toppy.
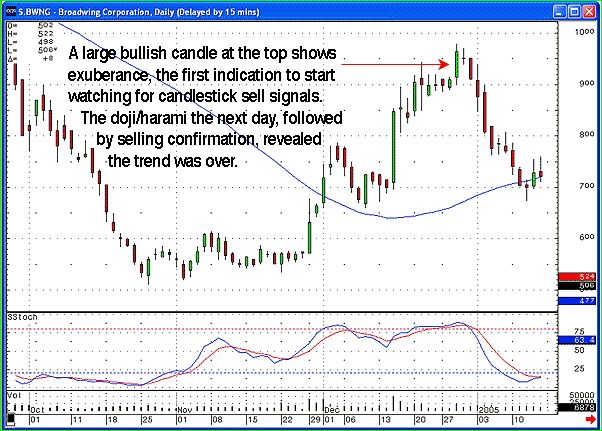
FIGURE 1: TAKING PROFITS. Several candlestick signals suggest the market is getting toppy. Here you see a shooting star, a bearish engulfing pattern, and a hanging man. Now look at the trend exhibiting bullish candlestick formations, coming out of the congestion area. With simple candlestick analysis, we see that this would have been a signal to buy back into the positions that had previously pulled back, or to buy new positions that were showing good, strong buy signals when the DJIA moved up again. This is not rocket science. This is being able to visually analyze what the candlestick signals are telling us. The final trend has come to an end when stochastics show an overbought condition and candlestick sell signals appear. Once again, the probabilities tell us it is time to take profits. When the market in general starts to get toppy, the evaluation of individual stock charts becomes easier to analyze. If the markets are getting toppy and a stock position is following suit, why go against the probabilities? Take profits! If the market turns back up or the stock starts showing buy signals again, it can always be bought back. There is no reason to sacrifice profits when signals that have worked effectively for centuries indicate other investors are getting out. As can be seen in the Broadway Corp. (BWNG) chart in Figure 2, the stochastics were in the overbought area for a few weeks. As the markets started to show some weakness at the end of 2004, BWNG formed a doji/harami, followed by selling confirmation the next day, causing the stochastics to start to curl down.
FIGURE 2: CONFIRMING INDICATORS. In this chart of Broadwing Corp. (BWNG), the stochastics were in overbought territory for most of December. The doji/harami that formed after the large bullish candle indicated that a top had been reached. All these conditions — a bearish harami confirmed and the markets starting to sell off — create a high-probability situation indicating that it is time to close out BWNG and take profits.
COULD THE PRICE GO HIGHER? Naturally, emotional obstacles like greed and fear can make it difficult for any investor to consistently follow any system and produce profitable trades. It's especially difficult to find a system that designates sell signals that an investor is willing to listen to. Yes, the price could always go higher. But whether you are a fundamental investor or a technical trader, the signals provide an excellent format for establishing when to buy and when to take profits. When the candlestick signals tell you it's time to sell, don't fight a system with centuries of evident success.
Stephen W. Bigalow is author of Profitable Candlestick Investing, Pinpointing Market Turns to Maximize Profits and High Profit Candlestick Patterns. He is also the principal of www.candlestickforum.com. He may be reached at steve@candlestickforum.com Current and past articles from Working Money, The Investor's Magazine, can be found at Working-Money.com |
Stephen W. Bigalow is an author and the principal of the www.candlestickforum.com, a website for providing information and educational material about candlestick investing.
| Website: | www.candlestickforum.com |
| E-mail address: | sbigalow@msn.com |
PRINT THIS ARTICLE

|

Request Information From Our Sponsors
- VectorVest, Inc.
- Executive Premier Workshop
- One-Day Options Course
- OptionsPro
- Retirement Income Workshop
- Sure-Fire Trading Systems (VectorVest, Inc.)
- Trading as a Business Workshop
- VectorVest 7 EOD
- VectorVest 7 RealTime/IntraDay
- VectorVest AutoTester
- VectorVest Educational Services
- VectorVest OnLine
- VectorVest Options Analyzer
- VectorVest ProGraphics v6.0
- VectorVest ProTrader 7
- VectorVest RealTime Derby Tool
- VectorVest Simulator
- VectorVest Variator
- VectorVest Watchdog
- StockCharts.com, Inc.
- Candle Patterns
- Candlestick Charting Explained
- Intermarket Technical Analysis
- John Murphy on Chart Analysis
- John Murphy's Chart Pattern Recognition
- John Murphy's Market Message
- MurphyExplainsMarketAnalysis-Intermarket Analysis
- MurphyExplainsMarketAnalysis-Visual Analysis
- StockCharts.com
- Technical Analysis of the Financial Markets
- The Visual Investor


