HOT TOPICS LIST
- Strategies
- Stocks
- Buy
- Investing
- Brokers
- Psychology
- Interviews
- Accumulate
- Sell
- Hold
- Spotlight
- Websites
- Candlestick Corner
- Gold & Metals
- Options Trading
LIST OF TOPICS
INVESTING
How Mergers And Acquisitions Affect Shareholder Wealth
02/23/05 01:33:58 PM PSTby George Coontz & J. Tim Query
It's a hot topic among investors, and here's why.
| Investors like to discuss mergers and acquisitions. Some argue that M&A increase efficiency, while others argue that they decrease the welfare of the consumer because of monopoly power. In this article we will look at the efficiency aspect of mergers and acquisitions and what kind of an effect, if any, it has on shareholder wealth.
Why M&A?Companies have various motives for going through with a merger. One — which should come as no surprise — is to increase their profitability and shareholder wealth, which is done by an increase in stock prices. When share prices increase, shareholder wealth increases, and this attracts investors. Another motive for M&A is to diversify, because by reducing dependence on a relatively nondiversified product line, earnings may be smoothed. The larger a corporation, the more efficient its inputs of capital and labor are. So by producing more at higher efficiency levels, they are able to produce more at cheaper rates. Then, of course, there is geographic expansion, which can be beneficial in reducing costs. In this study, we analyzed the relationship of mergers and acquisitions to shareholder wealth during a specific time. We did so to help investors better understand the market and its reactions to merger announcements so they can determine the optimal time to invest. Our hope is to find a reliable consistent change in shareholder wealth around the date of the merger announcement. We examined data from 69 of the largest 100 mergers in history in order to obtain an average increase or decrease in shareholder wealth. Several studies have investigated the various aspects of motives and shareholder wealth effects. In a study by Terrence C. Langetieg, he indicated that mergers have an impact on stockholder welfare. He found that 18 and six months before the merger, stockholder benefits were 6.11% and -1.61%, respectively. This suggests that shareholder gains were statistically insignificant. Ben Amoko-Adu and Joseph Yagil noted in a study that two months before the announcement date is the first month where the change in shareholder wealth is significant. They also found that from two months before to two months after the announcement date is where most of the gains occur. Before and after those dates, gains are not statistically significant from zero.
The studyThe stock price data for this study was acquired from Yahoo! Finance. Using adjusted stock price controls for stock splits and dividends during the sample period, we obtained the exact time period data needed for each company from this source. The exact announcement dates were found using Mergerstat Review 2003 for price data on the companies used in the study. This journal provides all the company information, merger information (type and size), and dates necessary. The original sample set consisted of the 100 largest mergers in the history of the US financial markets. Data was unavailable for 31 mergers for various reasons, including a subsequent takeover by another company making stock prices unavailable, insufficient announcement date data for some mergers, and some mergers or acquisitions undertaken by a nonpublic company or partnership. We collected our data on the Standard & Poor's 500 index from Yahoo! Finance and the S&P company website. The data spans 19 of 50 industry classifications, which are categorized from the thousands of SIC industry codes. The S&P 500 data is used as a proxy for the whole market and as a control for seasonal market fluctuations and trends. We obtained data for 180 trading days before announcement (the reason behind using data prior to announcement is to get a sense of the normal fluctuations compared to the S&P 500) and 30 days after the merger announcement. We analyzed this range of dates so we could determine their change over time. The equation is:
This equation will provide a cross-firm comparison for the study. If this value is largely positive or negative, it means there is a significant difference between the S&P 500 and shareholder wealth of the acquiring firm. If the value is small, either positive or negative, it means the deviation from the index is very small. The results of this study generally corroborate with the three hypotheses. Figure 1 summarizes the statistical results of the sample data.
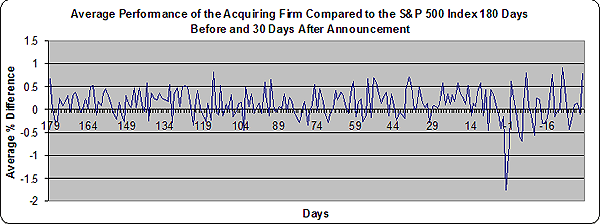
The first hypothesis, that before the merger or acquisition announcement, corporations tested (on average) will have shareholder wealth comparable to that of the S&P 500 index, was supported. During the 180 days before a merger announcement, the general trend was that the companies outperformed the S&P 500 with consistency. Although daily fluctuations existed, there were more days that outperformed the S&P than those that underperformed it: 123 (68.7%) to 56 (31.3%), respectively. As Figure 2 illustrates, there is a sharp downturn at the announcement.
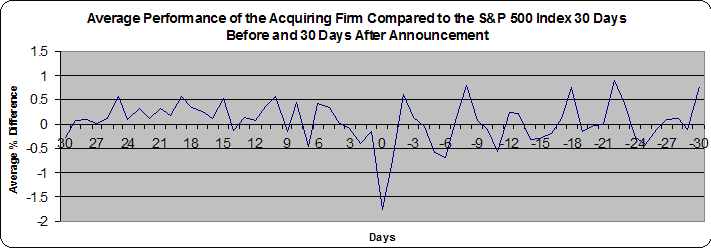
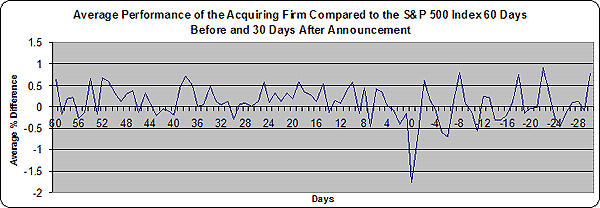
The second hypothesis, that on the announcement date, shareholder wealth will decrease compared to the S&P 500 index was also substantiated. The announcement of a merger is often accompanied by a sharp downturn of shareholder wealth compared to the S&P 500. The downturn in shareholder wealth is -1.75%. This could be because investors may be dubious of significant economic or financial advantages resulting from the merger. It also suggests a significant psychological effect of any change in outlook for the future, which negatively affects shareholder wealth. The shareholder wealth seems to rebound after the announcement, possibly due to the psychological effects of this disruption of the normal day-to-day cycle. This negative return of shareholder wealth is by far lower than any other day in my sample. Refer to Figure 3 for a graphical depiction of these conclusions.
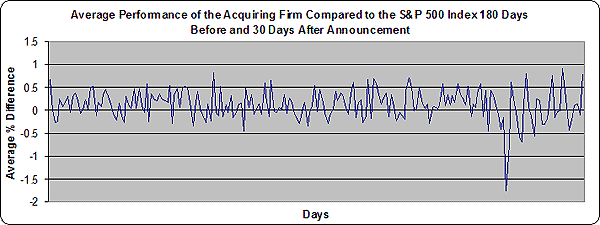
The third and final hypothesis, that after the merger or acquisition announcement shareholder wealth will fluctuate with a greater volatility around preannouncement levels, is not rejected. Volatility is higher after the merger announcement than before, as can be seen by the higher peaks and lower troughs. Minimum value preannouncement is -0.46%, whereas post-announcement value is -0.74%. Maximum value prior to the merger is 0.80, while after the merger it is 0.90. If you examine the standard deviations, which measures how widely values are dispersed from the mean, you'll see that the standard deviation pre-announcement is 0.27, while post-announcement it is 0.44. As illustrated in Figure 4, before the announcement fluctuations over the time frame of interest are only approximately 0.5%, compared to fluctuations of more than 1% in shareholder wealth after the announcement. Refer back to Figure 1 for statistical analysis.
Another unexpected interesting finding was that the troughs become shallower as the announcement date approaches. After the announcement, there is an elevation in the bottom of the troughs. (See Figure 5.) The reason for such an occurrence is pure conjecture at this stage, but it would be interesting to see if this happens before other events. Is this signaling an upcoming event or is it just a natural occurrence in shareholder wealth?
George Coontz is affiliated with the Graduate School of Business at Loyola University, Chicago. J. Tim Query works with the Department of Business Administration at Illinois Wesleyan University.
ReferencesAmoko-Adu, Ben and Joseph Yagil [1986]. "Stock Price Behavior Between The Base, Announcement, And Consummation Dates Of The Merger," Journal of Economics and Business, Volume 38.Langetieg, Terrence C. [1978]. "An Application Of A Three Factor Performance Index To Measure Stockholder Gains From Mergers," Journal of Financial Economics, Volume 6. Standard and Poor's. http://www.standardandandpoors.com Steiner, Peter O. [1975]. Mergers: Motives, Effects, Policies, University of Michigan Press.
Yahoo Finance (http://finance.yahoo.com) Current and past articles from Working Money, The Investors' Magazine, can be found at Working-Money.com.
|
| E-mail address: | gcoontz@luc.edu ; tquery@iwu.edu |
PRINT THIS ARTICLE

|

Request Information From Our Sponsors
- StockCharts.com, Inc.
- Candle Patterns
- Candlestick Charting Explained
- Intermarket Technical Analysis
- John Murphy on Chart Analysis
- John Murphy's Chart Pattern Recognition
- John Murphy's Market Message
- MurphyExplainsMarketAnalysis-Intermarket Analysis
- MurphyExplainsMarketAnalysis-Visual Analysis
- StockCharts.com
- Technical Analysis of the Financial Markets
- The Visual Investor
- VectorVest, Inc.
- Executive Premier Workshop
- One-Day Options Course
- OptionsPro
- Retirement Income Workshop
- Sure-Fire Trading Systems (VectorVest, Inc.)
- Trading as a Business Workshop
- VectorVest 7 EOD
- VectorVest 7 RealTime/IntraDay
- VectorVest AutoTester
- VectorVest Educational Services
- VectorVest OnLine
- VectorVest Options Analyzer
- VectorVest ProGraphics v6.0
- VectorVest ProTrader 7
- VectorVest RealTime Derby Tool
- VectorVest Simulator
- VectorVest Variator
- VectorVest Watchdog


