HOT TOPICS LIST
- Strategies
- Stocks
- Buy
- Investing
- Brokers
- Psychology
- Interviews
- Accumulate
- Sell
- Hold
- Spotlight
- Websites
- Candlestick Corner
- Gold & Metals
- Options Trading
LIST OF TOPICS
CANDLESTICK CORNER
When To Sell? Candlesticks Tell
02/07/05 11:16:23 AM PSTby Stephen W. Bigalow
Candlesticks can be useful in helping to delete your emotions from trading.
| Candlestick signals are as accurate for defining when to sell as they are for showing when to buy. Considering that the signals are still profitable after hundreds of years, we can only assume that something in the signals work. As hard as it is for most investors to find a system that produces good trades, it is even harder to figure out when to sell, especially when the enthusiasm is running over for owning a stock.
Buy low, sell highThe same emotional problems that most investors have when buying into a stock occur just as frequently when investors try to figure out when to sell. Japanese traders have a saying: Let the market tell you what it is going to do. But that's difficult to follow when you have a multitude of opinions of where the market or a specific stock price is going. Signals generated by candlestick charts will give you an unbiased opinion of the markets by circumventing that noise, hence making it easier to analyze the direction of the markets and stock price trends. Candlestick signals are formed by the cumulative knowledge of all the investor input — that is, the buying and selling — of a trading entity during a certain time period. No matter what you hear elsewhere, the candlestick signals tell you exactly what investor sentiment is doing.
Greed and fearWhen you are fortunate enough to be holding a long position in a stock that has made a strong up move, when do you sell? At this point, two emotional elements enter the picture: greed and fear. The average investor wants to hold onto profitable stock positions in the hopes that it could keep bringing in high returns. When this happens, you start imagining how much money you would make if the trend continued for another profitable 20 points. This type of thinking deters the rational decision of selling when it is time to sell. Instead of analyzing where and when the trend could be ending, the overriding factor becomes what the stock price could be. Next is the fear factor. You're afraid of selling out too early. After all, it's hard enough to identify profitable trades, and so the natural instinct is not to sell out too early. That fear causes you to hold onto a position well past the time that it should have been sold. Candlestick signals eliminate that dilemma and could increase your profits. Although buying and selling with candlestick signals gives you an objective way to trade the markets, that doesn't mean that every buy or sell signal is going to work correctly. But it does increase your chances of being in a position that will give you desirable results. It also allows you to close out trades that aren't working immediately and to cut your losses short. Further, there is nothing wrong with selling a position when the probabilities say it is time to sell and buying back later when the signals indicate that is time to buy again. Similarly, there is nothing wrong with getting out of a position when the signals say it is a good time to get out and buying back, even at a higher price, when the signals indicate the buyers are coming back in.
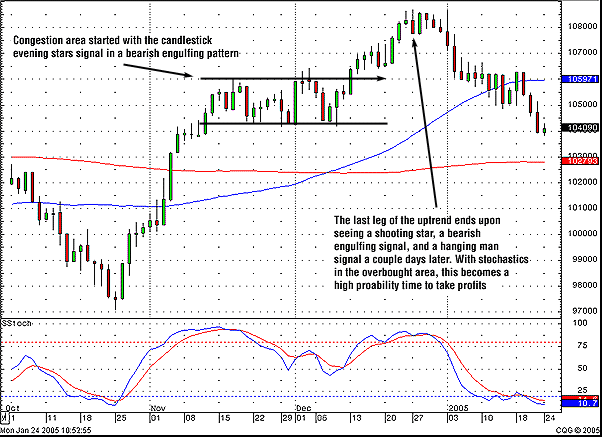
Why fight it?As seen in the Dow Jones Industrial Average (DJIA) chart in Figure 1, the bullish trend from late October into mid-November started to reveal candlestick sell signals, indicating the trend was ending, suggesting that either the trend would reverse or prices would move in a congestion zone. You can see a morning star signal, a bearish engulfing signal, and a few dojis. The congestion area that formed in the DJIA should have prompted you to look at some of the stock charts in the index and, in the event you were holding long positions, take profits in those that had a similar chart pattern. In December 2004, the DJIA started moving out of the congestion area as shown by the bullish candlestick formations. This would have been a signal to buy back either those stocks you had sold or buy new positions that were showing good strong buy signals at the time the DJIA was moving up again.
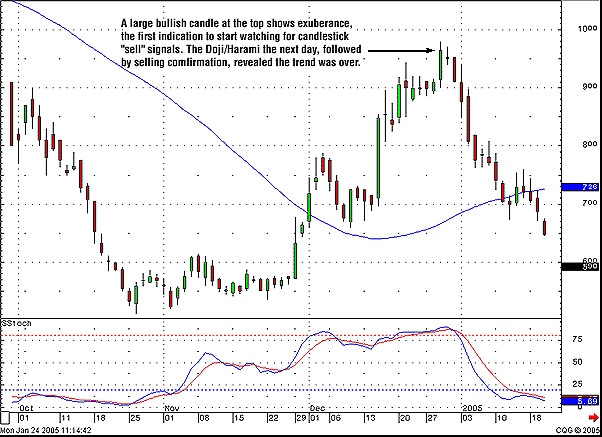
Figure 1: Dow Jones Industrial Average. The end of the bullish trend and start of a congestion zone are indicated by candlestick signals such as evening stars, bearish engulfing patterns, and dojis. The shooting star, bearish engulfing signal, and hanging man together with overbought stochastics indicate the major trend may be over. As a confirming tool I added the stochastic indicator. When the stochastics show an overbought condition while the candlestick sell signals appear, it's a sign that the final trend has come to an end. Once again, the probabilities tell us that it is time to take profits. When the market starts to top out, it becomes easier to analyze the valuation of an individual stock chart. Take a look at the chart of Broadwing Corp. (BWNG) in Figure 2. The stochastics had been in the overbought area for a few weeks. As the markets were starting to show some weakness at the end of 2004, BWNG formed a doji/harami, followed by selling confirmation the next day, causing the stochastics to start to curl down. All the conditions — a bearish harami confirmed and the markets starting to sell off — create a high-probability situation that it is time to close out BWNG and take profits.
Figure 2: Broadwing Corporation (BWNG). Here, the stochastics were overbought for about a month before the end of a trend was indicated by the candlestick sell signals such as the doji/harami. Could the price go higher? Yes, but when the candlestick signals tell you it is time to sell, don't fight it. Doing so will take the emotion out of investment decision-making. When you create a trading program with the capabilities of providing high-profit situations, take advantage of those parameters. Once you begin to "hope" that a trade will work despite what the charts indicate, that means the investor is hoping for a low-probability situation to occur. That is not how to invest.
Steve Bigalow is author of Profitable Candlestick Investing, Pinpointing Market Turns To Maximize Profits and principal of the www.candlestickforum.com. Bigalow manages the Candlestick Trading Hedge Fund and has developed multiple successful trading programs for the daytrader to the long-term hold investor. Charts courtesy CQG. Current and past articles from Working Money, The Investors' Magazine, can be found at Working-Money.com.
|
Stephen W. Bigalow is an author and the principal of the www.candlestickforum.com, a website for providing information and educational material about candlestick investing.
| Website: | www.candlestickforum.com |
| E-mail address: | sbigalow@msn.com |
PRINT THIS ARTICLE

|

Request Information From Our Sponsors
- StockCharts.com, Inc.
- Candle Patterns
- Candlestick Charting Explained
- Intermarket Technical Analysis
- John Murphy on Chart Analysis
- John Murphy's Chart Pattern Recognition
- John Murphy's Market Message
- MurphyExplainsMarketAnalysis-Intermarket Analysis
- MurphyExplainsMarketAnalysis-Visual Analysis
- StockCharts.com
- Technical Analysis of the Financial Markets
- The Visual Investor
- VectorVest, Inc.
- Executive Premier Workshop
- One-Day Options Course
- OptionsPro
- Retirement Income Workshop
- Sure-Fire Trading Systems (VectorVest, Inc.)
- Trading as a Business Workshop
- VectorVest 7 EOD
- VectorVest 7 RealTime/IntraDay
- VectorVest AutoTester
- VectorVest Educational Services
- VectorVest OnLine
- VectorVest Options Analyzer
- VectorVest ProGraphics v6.0
- VectorVest ProTrader 7
- VectorVest RealTime Derby Tool
- VectorVest Simulator
- VectorVest Variator
- VectorVest Watchdog


