HOT TOPICS LIST
- Strategies
- Stocks
- Buy
- Investing
- Brokers
- Psychology
- Interviews
- Accumulate
- Sell
- Hold
- Spotlight
- Websites
- Candlestick Corner
- Gold & Metals
- Options Trading
LIST OF TOPICS
FOCUS ON
The Dow's Dogs, Undaunted
01/25/05 12:04:42 PM PSTby David Penn
A bearish sawtooth pattern in stocks in 2004 couldn't hold back the littlest underdogs of the Dow 30.
| One of the best things about the Dogs of the Dow method is its simplicity. Unlike many other investment rules that require regular market-watching or an understanding of balance sheets or technical analysis tricks, the Dogs of the Dow requires — essentially — one day of work a year. Moreover, unlike a number of investment stratagems that are really little more than truisms (such as the January effect, the "Super Bowl" strategy, "Sell in May and go away," and "Buy Thanksgiving and sell New Year's"), the Dogs of the Dow method is based on sound, value-oriented investment principles. After all, in purchasing the stocks of Dow 30 companies, investors are putting their money with well-known (and generally highly regarded) companies with healthy dividend yields. Compare this to investing in Nasdaq stocks — most of which do not pay dividends and, as the 2000-02 experience informs us, are often the first slaughtered when bear markets roll around. Nevertheless, to steal a phrase from Orwell's Animal Farm, all dogs might be equal, but some dogs are "more equal" than others. In the case of the Dogs of the Dow's performance in 2004, the "more equal" dogs appear to have been the littlest dogs in the pound. How so? Because while the general Dogs of the Dow methodology — popularized by Michael O'Higgins in his 1991 book, Beating The Dow — turned in an underwhelming 1.4% loss performance in 2004, the "Little Dogs of the Dow" crossed the finish line with a Dow Jones Industrial Average (Djia) and Standard & Poor's 500beating 10.5% return. And this is without including gains from dividends.
Dancing with dogsWriting in How To Retire Rich, James O'Shaughnessy says of the Dogs of the Dow method:
"The beauty of the Dogs of the Dow is that you can look at its performance all the way back to 1929 — Say it's 1929. On the eve of the biggest crash in market history, you've decided to put your money in Dogs of the Dow. You stick with it, and by 1938 you have not lost money, although the crash ushered in the worst depression this country has ever experienced and many other investors are financially ruined. The $10,000 you invested on December 31, 1928, was worth $10,888 in 1938. And that's just if you made a lump-sum investment of $10,000 before the market crashed. Had you put $2,000 a year in Dogs of the Dow between 1928 and 1939, your $22,000 investment would have grown to $38,765, a gain of 76 percent in one of the worst 10-year periods in American economic history!"
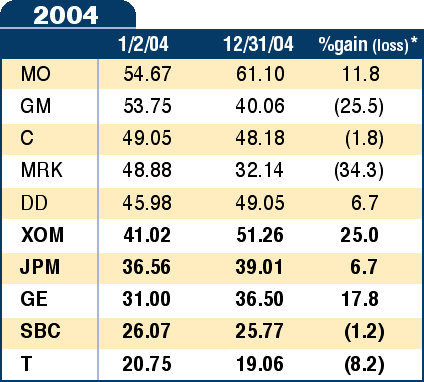
Consider the Dogs of the Dow's more recent performance in 2004. To recap the simple methodology, all an investor needs to do at the end of the year is look up a list of the Dow 30 components. Find the 10 highest-yielding Dow stocks as of the end of the year and invest in them equally. This process is repeated every year: select the 10 highest-yielding stocks in the DJIA and invest in them for the duration of a year. From time to time, stocks drop in and out of this "top 10" — so don't assume that the same stocks will be the 10 highest-yielding every year. I noted that the variation on this strategy — the "Little Dogs" significantly outperformed the basic Dogs of the Dow approach. How does the Little Dogs variation work? The Little Dogs variation calls for locating the 10 highest-yielding stocks in the DJIA at year's end, but then suggests investing only in the lowest-priced five. This Little Dogs method adds a sort of value component to the strategy — one that appears to have worked out for the better for many Dogs of the Dow investors over the years. For example, in 2004, the Dogs of the Dow put in the following performances. Five of the stocks were profitable over the course of the year, while five were losers:
Figure 1: The Dogs of the Dow put in a mediocre performance in a year that was bearish for longer than it was bullish. That said, the Little Dogs managed to be many of the Dow's gainers. *Excluding dividends The losers were significant indeed: General Motors (GM) lost more than 25%, Merck (MRK) lost more than 34%, and AT&T (T) lost more than 8% over the period. But keep in mind also that these are all dividend-paying stocks, so even those that did not experience significant capital appreciation (Citigroup [C] and SBC Communications [SBC], for example) still took care of investors with a healthy dividend yield. The same is true of those big Dogs of the Dow losers in 2004. By the end of 2004, even shell-shocked investors of General Motors and Merck were receiving 4.99% and 4.73% in dividend payouts. Now, for something really interesting, take a look at the table's bottom five stocks — Exxon Mobil (XOM), JP Morgan Chase (JPM), General Electric (GE), SBC Communications (SBC), and AT&T. These five represent lowest price in dollar terms and make up the Little Dogs variation mentioned earlier. The one sizable loser in this bunch is more than mitigated by the performance of stocks like XOM, GE, and JPM. In fact, given that the biggest losers were among the "Big Dogs," it is no exaggeration to suggest that the Little Dogs of the Dow was the only thing that kept the broader Dogs of the Dow above water in 2004.
Dogging 2005One straightforward and thorough resource on the Internet for traders and investors interested in the Dogs methodology is dogsofthedow.com. This no-frills website not only provides current and past Dogs of the Dow, but keeps a running daily and weekly scorecard on how the different Dogs are doing. What is especially nice is the way dogsofthedow.com provides regular updates on the top-yielding and lowest-priced Dow components. This makes it easy for an investor to pick when to start his or her year-long 365-day holding period. While most discussions of the Dogs begin and end at the start of the year (or at the end of the year), dogsofthedow.com's easy-to-use database makes it easy for traders and investors to begin dogging the Dow from April 1 to March 31, or from July 23 in one year to July 22 of the next. Again, the important point is that there is nothing sacred about using the calendar year; any consecutive 365-day period will do. Picking new Dogs every year is a tradition among many who follow the methodology. With that in mind, what cohort of Dogs (and Little Dogs) will those who started their Dogs of the Dow play at the beginning of 2005?
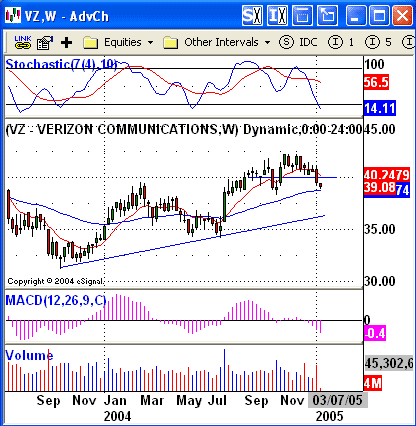
Figure 2: A negative stochastic divergence in this weekly chart of Verizon suggests that the rally that began in October 2003 may be nearing an end. Comparing the 2004 Dogs of the Dow roster to the 2005 Dogs roster shows two switches. T and XOM are both out, and Verizon (VZ) and Pfizer (PFE) are both in. This takes out the oil stock — one that performed especially well in 2004 — and adds an additional pharmaceutical stock alongside Merck. And what kind of stocks have Pfizer and Verizon been in recent months? Pfizer, like a good number of pharmaceutical stocks, had a terrible 2004, beginning the year at $35.43 and ending the year at $26.89 for a 24% decline. Verizon, on the other hand, fared much better, starting the year at $35.10 and ending more than 15% higher at $40.51. Technically, it appears that both Pfizer and Verizon may begin 2005 with at least a temporary reversal of 2004 fortunes. Considering Verizon first, the dominant technical feature on its weekly chart is the negative stochastic divergence in the fall of 2004. This negative divergence threatens to put a top of some significance on the bull market in Verizon shares that has its origins in the lows of October 2003. As of this writing, the negative stochastic divergence has been confirmed (see my Working-Money.com article, "Confirming Divergences" from December 22, 2004, for an explanation of what I mean by "confirmed"), even if the most recent correction low of $38.26 from October 2004 has yet to be taken out by the current pullback. As of this writing, Verizon is testing its 50-week exponential moving average (EMA) for support at the $39 level.
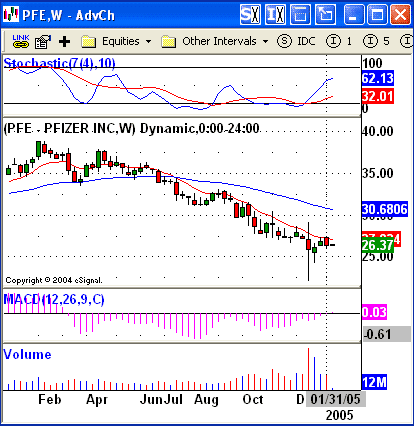
Figure 3: A selling climax in December and a positive stochastic divergence on the weekly charts suggests that Pfizer may be among the early winners in 2005. According to the weekly chart of Pfizer, the stock may have suffered through a bad case of "been down so long it looks like up to me." While Pfizer did indeed spend the majority of 2004 in a relentless bear market, it appears that December might have marked a selling climax in the stock. The "day of reckoning" in Pfizer appears to have been December 17. On a day of market-shaking volatility, Pfizer experienced an explosion in volume. In fact, more shares traded for Pfizer (over 456 million) on that day compared to any other day in more than 10 years. At the same time, Pfizer's weekly chart showed a positive stochastic divergence between the August lows and the December lows. Either technical development alone would be significant enough to draw attention. Combined, the selling climax and the positive stochastic divergence are especially bullish on the weekly chart for the drugmaker.
David Penn may be reached at DPenn@Traders.com.
Suggested readingHiggins, Michael [1991]. Beating The Dow. HarperBusiness.Merrill, Arthur A. [1984]. Behavior Of Prices On Wall Street. Analysis Press. O'Shaughnessy, James [1998]. How To Retire Rich. Broadway Books.
Data courtesy eSignal Current and past articles from Working Money, The Investors' Magazine, can be found at Working-Money.com.
|
Technical Writer for Technical Analysis of STOCKS & COMMODITIES magazine, Working-Money.com, and Traders.com Advantage.
| Title: | Traders.com Technical Writer |
| Company: | Technical Analysis, Inc. |
| Address: | 4757 California Avenue SW |
| Seattle, WA 98116 | |
| Phone # for sales: | 206 938 0570 |
| Fax: | 206 938 1307 |
| Website: | www.traders.com |
| E-mail address: | DPenn@traders.com |
Traders' Resource Links | |
| Charting the Stock Market: The Wyckoff Method -- Books | |
| Working-Money.com -- Online Trading Services | |
| Traders.com Advantage -- Online Trading Services | |
| Technical Analysis of Stocks & Commodities -- Publications and Newsletters | |
| Working Money, at Working-Money.com -- Publications and Newsletters | |
| Traders.com Advantage -- Publications and Newsletters | |
| Professional Traders Starter Kit -- Software | |
PRINT THIS ARTICLE

|

Request Information From Our Sponsors
- StockCharts.com, Inc.
- Candle Patterns
- Candlestick Charting Explained
- Intermarket Technical Analysis
- John Murphy on Chart Analysis
- John Murphy's Chart Pattern Recognition
- John Murphy's Market Message
- MurphyExplainsMarketAnalysis-Intermarket Analysis
- MurphyExplainsMarketAnalysis-Visual Analysis
- StockCharts.com
- Technical Analysis of the Financial Markets
- The Visual Investor
- VectorVest, Inc.
- Executive Premier Workshop
- One-Day Options Course
- OptionsPro
- Retirement Income Workshop
- Sure-Fire Trading Systems (VectorVest, Inc.)
- Trading as a Business Workshop
- VectorVest 7 EOD
- VectorVest 7 RealTime/IntraDay
- VectorVest AutoTester
- VectorVest Educational Services
- VectorVest OnLine
- VectorVest Options Analyzer
- VectorVest ProGraphics v6.0
- VectorVest ProTrader 7
- VectorVest RealTime Derby Tool
- VectorVest Simulator
- VectorVest Variator
- VectorVest Watchdog


