HOT TOPICS LIST
- Strategies
- Stocks
- Buy
- Investing
- Brokers
- Psychology
- Interviews
- Accumulate
- Sell
- Hold
- Spotlight
- Websites
- Candlestick Corner
- Gold & Metals
- Options Trading
LIST OF TOPICS
INSIDER TRADING
Insider Trading Hits Four-Year High
12/08/04 03:03:40 PM PSTby Matt Blackman
Insider selling soared in November to the highest level since August 2000, which coincided with the last major peak in the S&P 500 index before the recession. Are corporate insiders trying to tell us something?
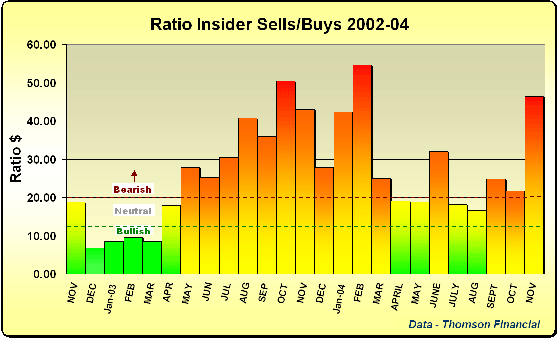
| In November, insider selling soared to $6.6 billion in shares of their own companies, a whopping 180% jump from October's figure of $2.3 billion, according to the insider research team at Thomson Financial. It was the highest level of selling since August 2000, when insiders sold $7.7 billion in shares. November sales more than tripled the 10-year average 50% increase in selling from October to November as executives conducted tax-related sales and are released from third-quarter earnings season restrictions. November's insider sell/buy ratio of $46.45 (in shares sold for every $1 purchased) more than doubled the October reading of $21.65 (see Figure 1). This was the third-highest reading (behind February 2004 and October 2003) since the February 1991 all-time high of $54.87. According to the insider research team, the insider sell/buy ratio is the best overall measure of insider activity.
Figure 1: The insider sell/buy ratio during the last two years, showing the latest jump in value well into bearish territory and more than doubling the October reading.
Notable sectors of insider activity included technology in which insiders sold $1.5 billion in shares (an increase of 94% over October), finance (which experienced a 295% increase), and health (where insider selling jumped 150%). On a market capitalization basis, small-caps (companies with a market cap of less than $1 billion) experienced the greatest percentage increase in selling last month, according to Thomson analyst Kevin Schwenger. Share sales increased 400% from $475 million in October to $1.9 billion in November. Mid-caps were next, for which selling jumped 350% from $628 million to $2.2 billion in November. Finally, large-cap insider selling more than doubled in November to $2.6 billion. Of the three groups, large-cap buying experienced the biggest jump. Share purchases rocketed more than 500% from $4 million in October to $21 million in November. Small-cap buying increased 9% from $86 million to $94 million, and mid-caps showed a 32% increase over October, when share purchases increased from $108 million to $144 million. Sectors showing the greatest increase in buying were consumer services and business services. As I discussed in my last article ("What Are Insiders Telling Us?"), the fact that small-caps were outperforming large-caps in a falling dollar environment was a puzzle. Small-caps also showed some strong insider buying in October. However, this trend was not sustained through November. Large-caps conduct much more international business and are therefore net beneficiaries of a weak dollar. Small-caps generate more domestic business and benefit more from a strong dollar, especially if they import raw materials or products from overseas. It takes time for the benefits of a weakening dollar to accrue to large-caps, and this trend could be an initial indicator that this is finally beginning to occur. As long as the situation persists, look for large-caps to outperform mid- and small-caps, especially if interest rates stay low.
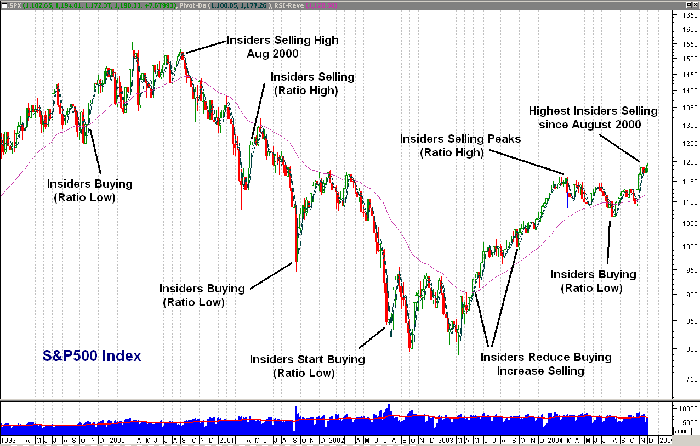
Figure 2: Weekly chart of the Standard & Poor's 500 index showing insider activity. Note the strong correlation between insider buying and lows versus insider selling and the highs.
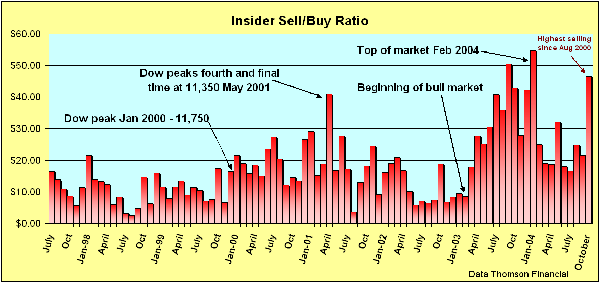
As we see in Figures 2 and 3, there has been a strong historical correlation between insider activity and price movement. Insiders have a knack for buying and selling at the right times. A thorough analysis, however, is not limited to examining changes in the insider sell/buy ratio. Changes in overall buying and selling activity must be examined independently.
Figure 3: This updated chart shows the insider sell/buy ratio values with Dow Jones Industrial Average price action. While insider selling in November 2004 was the highest since August 2000, the ratio reading was well above the level four years ago, indicating that there is was less buying in November.
It is important to point out that high levels of insider selling alone do not justify dumping stock holdings and exiting the market. As we saw in October 2003 when the sell/buy ratio topped $50, those exiting would have missed the next four months of market gains. Insiders sell for a variety of reasons related to cash needs such as taking paychecks, paying taxes, cashing in bonuses, or raising money for corporate purposes. Selling also increases after periods of excellent price appreciation, when insiders take profits. Strong buying, when insiders are trading their hard-earned money for shares in their own companies, has proven to be a very good signal to follow, especially after extended corrections. Insiders often know best when shares in their companies represent excellent value, and they begin buying in advance of a market bottom (as they did in August and October 2002). Investors who follow and are prepared to hang on until the market recovers are handsomely rewarded. Insider selling can be a very useful signal for those who know how to read it correctly. As we see from Figure 3, this information was valuable following a major drop in the ratio such as in March 2004, December through March 2003, and August 2002, when insider selling markedly dropped and buying jumped. According to Thomson Financial's James Mazzola, who tracks daily inside activity going back to 1986, insider buying in small- to mid-caps is a very important signal. However, selling in large-caps can be equally important, and this fact is often overlooked. He points to the period leading up to accounting scandals as a prime example, when insiders were selling at high levels in such large-caps as Enron and WorldCom. Investors and traders who followed suit were out long before these companies collapsed and the rest of the market suffered. While insiders sell for a variety of reasons, it is a common misconception that this activity is not necessarily important. This is certainly not the case with large-caps, nor when there is a strong negative rate of change in the insider sell/buy ratio month to month. When there is strong insider selling, it is a good idea to pay close attention. George Muzea, insider analyst and author of the new book The Vital Few Versus The Trivial Many, commented in his weekly "Magic T" newsletter that insiders were decidedly in "stay-out mode," based on the metrics he follows. These include advisory sentiment, state of the market, mood of the media, mood of friends and acquaintances, as well as insider activity. Based on his sentiment indicators, Muzea recommended that his clients refrain from buying stocks altogether, but acknowledged that long-term investors with core holdings might prefer to stick with them. This makes sense, given that large-cap insiders have increased buying activity of late. For those who like risk and are in the process of accumulating strong large-caps in stronger sectors, it would be a good idea to set tight stops and wait for strong signals ahead if these stops are triggered. Until clearer signals prevail, this is definitely a market for stockpickers and daytraders.
Matt Blackman is a technical trader, author, reviewer, keynote speaker, and regular contributor to a number of trading publications and investment/trading websites in North America and Europe. Blackman is an affiliate Market Technicians Association and Canadian Society of Technical Analysts member and is currently enrolled in the Chartered Market Technicians (CMT) program. He can be reached at matt@tradesystemguru.com.
Charts and data provided by MetaStock and Thomson Financial
SUGGESTED READINGBlackman, Matt [2004]. "What Are Insiders Telling Us?" Traders.com Advantage: December 1._____ [2004]. "September Insider Update," Traders.com Advantage: October 11. Murphy, John [1999]. Technical Analysis Of The Financial Markets, John Wiley & Sons. _____ [2004]. Intermarket Analysis: Profiting From Global Market Relationships, John Wiley & Sons. Muzea, George [2005]. The Vital Few Versus The Trivial Many: Invest With The Insiders, Not The Masses, Literary Press. · http://www.vitalfew.info/ Seyhun, Nejat H. [2000]. Investment Intelligence From Insider Trading, MIT Press. Thomson Financial [2004]. "Insider Selling Surges To Record Level In November," December 3. Current and past articles from Working Money, The Investor's Magazine, can be found at Working-Money.com.
|
Matt Blackman is a full-time technical and financial writer and trader. He produces corporate and financial newsletters, and assists clients in getting published in the mainstream media. He tweets about stocks he is watching at www.twitter.com/RatioTrade Matt has earned the Chartered Market Technician (CMT) designation.
| E-mail address: | indextradermb@gmail.com |
PRINT THIS ARTICLE

|

Request Information From Our Sponsors
- StockCharts.com, Inc.
- Candle Patterns
- Candlestick Charting Explained
- Intermarket Technical Analysis
- John Murphy on Chart Analysis
- John Murphy's Chart Pattern Recognition
- John Murphy's Market Message
- MurphyExplainsMarketAnalysis-Intermarket Analysis
- MurphyExplainsMarketAnalysis-Visual Analysis
- StockCharts.com
- Technical Analysis of the Financial Markets
- The Visual Investor
- VectorVest, Inc.
- Executive Premier Workshop
- One-Day Options Course
- OptionsPro
- Retirement Income Workshop
- Sure-Fire Trading Systems (VectorVest, Inc.)
- Trading as a Business Workshop
- VectorVest 7 EOD
- VectorVest 7 RealTime/IntraDay
- VectorVest AutoTester
- VectorVest Educational Services
- VectorVest OnLine
- VectorVest Options Analyzer
- VectorVest ProGraphics v6.0
- VectorVest ProTrader 7
- VectorVest RealTime Derby Tool
- VectorVest Simulator
- VectorVest Variator
- VectorVest Watchdog


