HOT TOPICS LIST
- Strategies
- Stocks
- Buy
- Investing
- Brokers
- Psychology
- Interviews
- Accumulate
- Sell
- Hold
- Spotlight
- Websites
- Candlestick Corner
- Gold & Metals
- Options Trading
LIST OF TOPICS
INVESTING
Grow And Protect: An Investment Strategy For Retirement
11/17/04 03:13:39 PM PSTby Allen Rehert
Here's one way to earn double-digit returns while preserving a retirement nest egg.
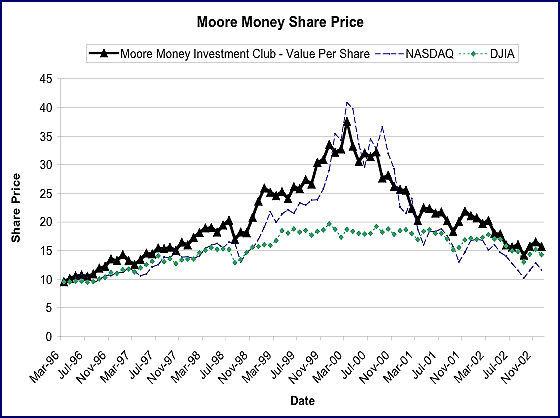
| After retiring in April 1996, I spent a lot of time playing the stock market with various leveraging approaches using options. During the runup, I (like most people) thought I was doing something very smart as I made money. When the bubble burst, it became clear that I was simply doing as well as the market -- which was good in good times, bad in bad times. After that realization, I began to look for ways to beat the bubble. During this same period, my condo association started a stock club. We followed the long-term investment principles of the National Association of Investment Clubs. Yet we also mimicked the bubble and had the same high and low emotional experience.
Figure 1: Moore Money Investment Club
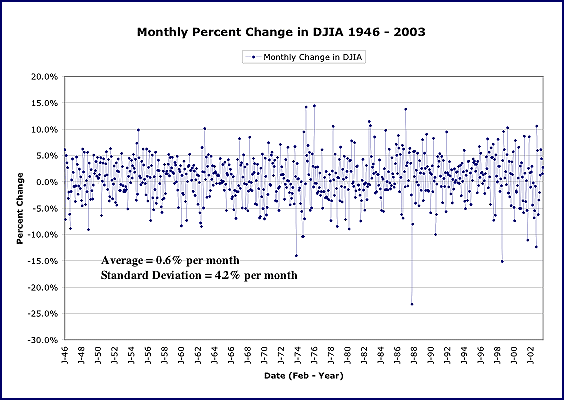
In retrospect, you can see from Figure 1 that the Dow Jones Industrial Average (DJIA) did not participate in the bubble. This observation made me consider that simply buying and holding the DJIA would take us partway toward avoiding the bubble's emotional roller coaster. Let's look in more detail at the DJIA's price behavior (Figure 2).
Figure 2: Monthly percent change in DJIA.
Most monthly changes in the DJIA are within 5% (plus or minus) of the prior month. Some months show changes as large as 15-25%. We can look at sequential monthly changes to better understand the behavior of the value of the DJIA.
Figure 3: DJIA percent change by pairs of months: 1946-2003
Figure 3 shows the change in the DJIA value for pairs of sequential months from 1946 to 2003. We can see that 32% of the time the DJIA increased in value two months in a row. For 80% of the time, the DJIA increased in value during at least one of the months, and 19% of the time, the DJIA declined two months in a row. However, for these cases, there are no points on the graph indicating two large sequential drops in the value of the DJIA (the lower left quadrant is mostly empty). This data suggests that the DJIA could increase over a long period and have few large sequential declines. This behavior lays the groundwork for an investment technique that meets the following objectives:
For a minimum of effort, we choose to make only one set of transactions per month. For a minimum of worry, the actions to be taken each month will be prescribed by a computer program and thus not require emotional involvement.
Grow and protect strategyThe general approach of this "grow and protect" strategy consists of one set of covered-call transactions on the third Friday of every month. These transactions consist of:
The key to making money with covered calls is for the value or premium received for selling the call to more than compensate for the risk of the stock's price dropping. The grow and protect strategy was designed to systematically accomplish this goal using monthly covered-call transactions.
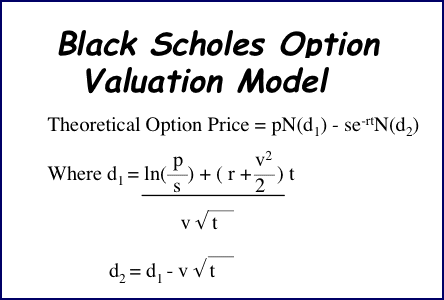
Simulation approachTo simulate historical results for covered calls, you will need to estimate the value of call options in the past. This is done using the Black-Scholes equation (Figure 4) with historical estimates for its parameters. The variables are: p = Stock price
Figure 4: Black-Scholes option valuation model
The Black-Scholes formula says that call option values increase with increasing stock price, higher ratios of stock price to strike price, higher time remaining until option expiration, higher risk-free interest rates, and higher volatility. All of these parameters are known, except volatility. To help estimate DJIA volatility, it's best to begin with the volatility for the Standard & Poor's 100, which is published daily by the Chicago Board Options Exchange (CBOE). We need to convert this published volatility of the S&P 100 into an historical estimate of the volatility of the DJIA.
Figure 5: DJIA vs. S&P 100 month-over-month change
Figure 5 shows that monthly changes in the DJIA and the S&P 100 are closely correlated. If one has high volatility, the other should have high volatility. Although not a perfect measure for the volatility of the DJIA, using the volatility of the S&P 100 as a surrogate should be accurate enough to suggest the results that will be achieved by the grow and protect approach. Now you have all the data needed to simulate the grow and protect approach. Before doing this, let's take a look at two statistical properties we will use to help set the strike price of monthly call options. These two properties are:
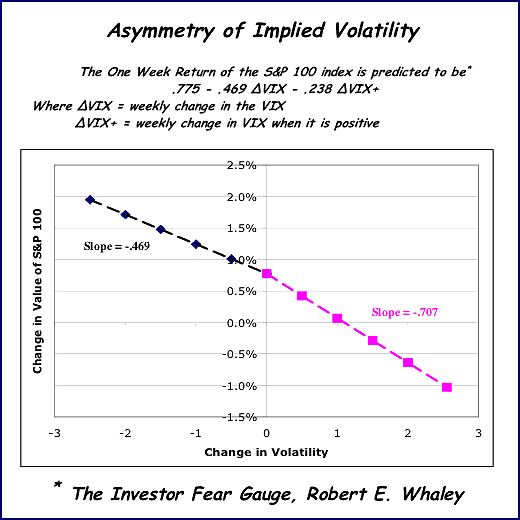
Changes in the value of the S&P 100 are correlated with changes in the volatility of the S&P 100. However, as you can see in the next chart, when the volatility increases (and fear increases), the impact on the price is larger than the corresponding impact when the volatility decreases. (See Figure 6.)
Figure 6: Asymmetry of implied volatility
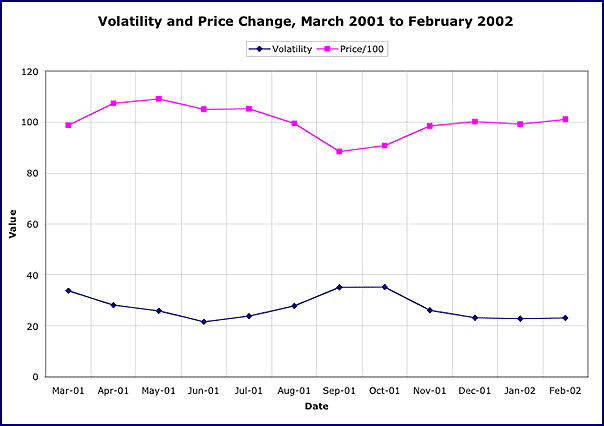
These observed increases in volatility will be used as a measure of possible future large price decreases and incorporated into the selection of each month's call option strike price. Reversion to the mean refers to a statistical property often occurring in nature. This property says that the greater the deviation of a random variate from its mean, the greater the probability that the next measured variate will deviate by a smaller value. For example, a lot of rain one month is likely to be followed by less rain in future months. To illustrate reversion to the mean in the stock market, we can look at the changes that occurred in the price and volatility of the DJIA after September 11, 2001.
Figure 7: Volatility and price change, March 2001-February 2002
This chart illustrates how the price (volatility) dropped (rose) after September 2001 but did not continue to decline (increase) after September. Instead, both price and volatility reverted back toward pre-September levels. We will also use reversion to the mean in our selection of strike price. We now have all the background we need to look at a simulation of the grow and protect investment technique.
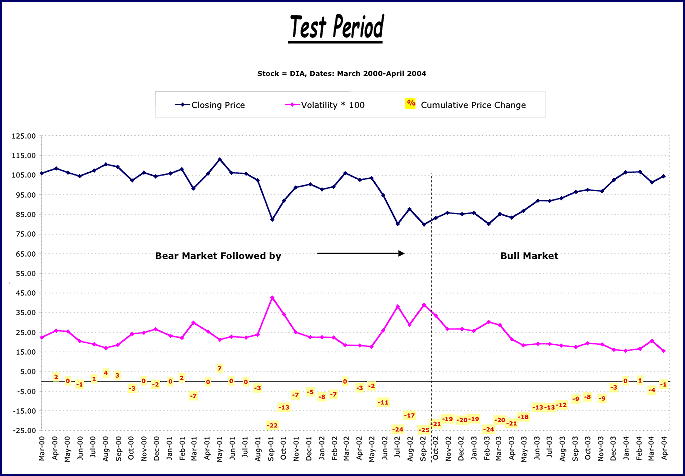
Simulation of bubble test periodTo test the grow and protect strategy (via simulation), we selected a test period that begins at the height of the bubble (March 2000) and continues to March 2004 (Figure 8).
Figure 8: Test period
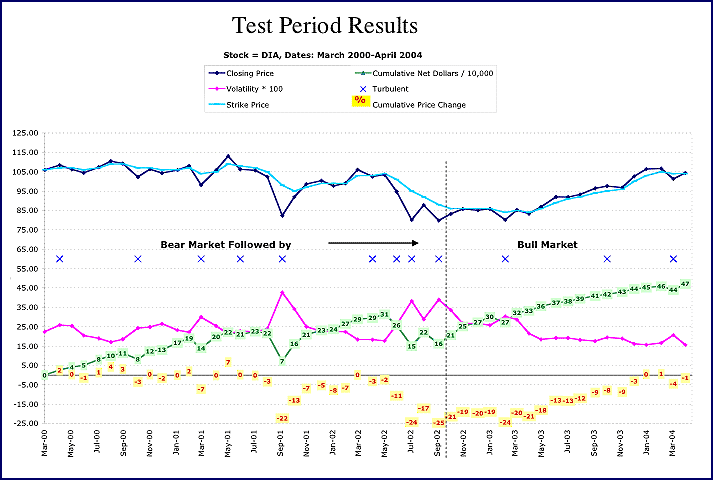
We can see that the DJIA declined by as much as 25% during this period. We can also see that at the end of the period, the DJIA price was very close to its value at the beginning of the period. You also see times when the volatility and price changes are correlated (volatility increases, price decreases). A reversion to the mean occurred around September 11, 2001, and at other times during this test period. To implement the grow and protect strategy, we first put 15% of our initial cash (assumed to be $100,000) aside for possible future use. We would need this cash if the price of DIA significantly declines. The price of DIA on our starting date of March 17, 2000, was 105.95. We select a strike price for our first transaction of 106 by simply rounding the stock price. The number of covered calls (buy-writes) will be the $85,000 available for investment, divided by the strike price of 106. This would have resulted in eight covered calls. We would have bought 800 shares of DIA at 105.95 for $84,760. We would sell eight calls with an expiration date of April 2000 at 319.9 for $2559.2. Our net cost for the covered calls would be 84760 2559.2 = 82,200. This would have left 100,000 82,200 = 17,800 in cash in our portfolio. One month later (April 21, 2000), DIA's price had increased to 108.44. We would sell our 800 shares and receive 84,800. Adding our cash gave us a total portfolio value of 102,600. We can begin a new "round" by purchasing 800 shares and selling eight May 2000 calls with a strike price of 107. This left us with cash of 19,153. One month later (May 19, 2000), DIA's price dropped to 106.27. Selling the 800 shares for the stock price gave us 85,015. Adding the cash in the account led us to 104,168. These two rounds would have resulted in a 4.2% gain in our portfolio, even though the price of DIA stayed pretty much constant (105.95 to 106.27). To illustrate what happens when the price of DIA drops substantially, we can move ahead to August 17, 2001 (the third Friday), when DIA was 102.41. After completing the round started in July 2001, we would have had a cash amount of $121,571. Starting the next round, we would buy 800 shares and sell eight September 2001 calls with a strike price of 105. The resulting cash would have been $41,294. One month later (September 21, 2001), DIA's price was 82.36. Selling the stock and adding the accumulated cash would have resulted in $107,182 in cash. The next action would have been to buy 900 shares and sell nine call contracts with a strike price of 98. After these actions, we would have $33,370 in cash. By October 19, 2001, DIA's price increased to 92.04. We would receive 82,837 for the stock. Adding the cash would have given us $116,207. Our portfolio "profit" went from 21% to 7% to 16% from August to September to October 2001. This occurred during a period when DIA went from 102.41 to 92.04 (a drop of more than 10%). The key to the grow and protect strategy is selection of the strike price. Grow and protect selects the strike price by using the concepts of asymmetry of implied volatility and reversion to the mean. The formulas used to do this are based on the historical and current values of the price and volatility of the DIA. To see how grow and protect strategy uses the strike price for our test period, let's see how we would have done under simulated conditions (Figure 9).
Figure 9: Test period results
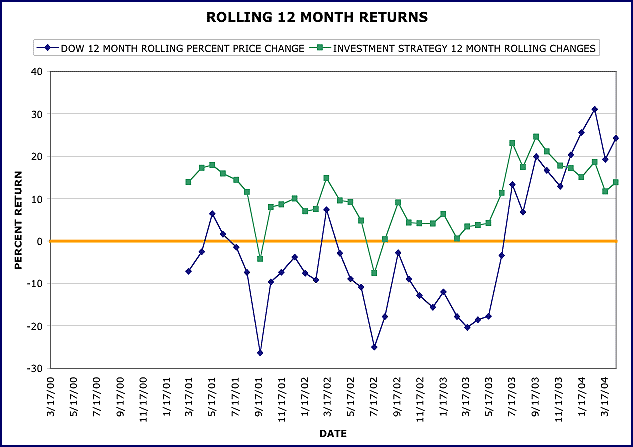
First, we see how the strike price (in light blue) stayed very close to the stock price unless there was a major change in the value of the stock price. Then the strike price was changed to be closer to the next expected stock price. The Xs on the chart showed those months where price or volatility actions suggested future price changes were likely to be more turbulent. The strike price was set differently during these months to reflect this additional information. We also show the cumulative "profit" (in green). The end point for this entire period showed a gain of 47% during a period in which the DJIA's value was virtually unchanged. In addition to looking at the entire test period, we can ask how the grow and protect strategy would have performed if we started at any point in the period and looked at the annual return.
Figure 10: Rolling 12-month returns
In Figure 10, we see a gap between the grow and protect result (green) and the corresponding DJIA result (blue). Even though the grow and protect returns dipped below zero twice during this period, there was a substantial improvement over the performance of the DJIA.
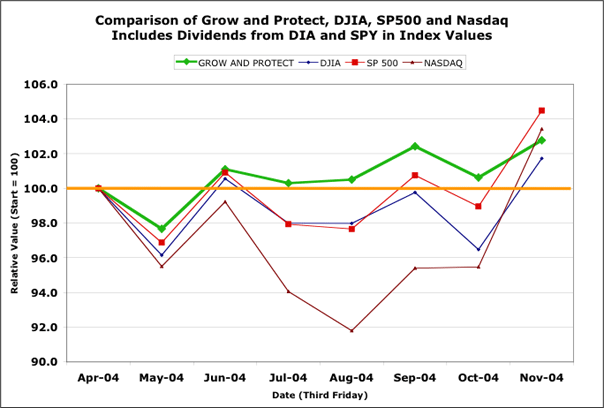
Future plansI can simulate the past as much as I like. However, the proof that the grow and protect strategy really works has to be based on decisions involving real money. And to prove it, starting on April 15, 2004, I sold all my holdings in one of my brokerage accounts so I could apply the grow and protect approach to an entirely new account. The results to date are shown in Figure 11.
Figure 11: Actual results
You can see how the grow and protect method has kept the value of my account positive during this year's flat-to-down market. Over the coming months, I expect to see how grow and protect increases the value of my account during an up market.
Allen Rehert is a retired business executive. He has Ph.D from the University of Pennsylvania. He may be reached at arehert@optonline.net.
Current and past articles from Working Money, The Investor's Magazine, can be found at Working-Money.com. |
| E-mail address: | arehert@optonline.net |
PRINT THIS ARTICLE

|

Request Information From Our Sponsors
- StockCharts.com, Inc.
- Candle Patterns
- Candlestick Charting Explained
- Intermarket Technical Analysis
- John Murphy on Chart Analysis
- John Murphy's Chart Pattern Recognition
- John Murphy's Market Message
- MurphyExplainsMarketAnalysis-Intermarket Analysis
- MurphyExplainsMarketAnalysis-Visual Analysis
- StockCharts.com
- Technical Analysis of the Financial Markets
- The Visual Investor
- VectorVest, Inc.
- Executive Premier Workshop
- One-Day Options Course
- OptionsPro
- Retirement Income Workshop
- Sure-Fire Trading Systems (VectorVest, Inc.)
- Trading as a Business Workshop
- VectorVest 7 EOD
- VectorVest 7 RealTime/IntraDay
- VectorVest AutoTester
- VectorVest Educational Services
- VectorVest OnLine
- VectorVest Options Analyzer
- VectorVest ProGraphics v6.0
- VectorVest ProTrader 7
- VectorVest RealTime Derby Tool
- VectorVest Simulator
- VectorVest Variator
- VectorVest Watchdog

