HOT TOPICS LIST
- Strategies
- Stocks
- Buy
- Investing
- Brokers
- Psychology
- Interviews
- Accumulate
- Sell
- Hold
- Spotlight
- Websites
- Candlestick Corner
- Gold & Metals
- Options Trading
LIST OF TOPICS
CANDLESTICK CORNER
Candlesticks 101: Doji
06/03/04 03:32:15 PM PSTby Margaret Austin
You've seen candlesticks before. You can see why they're called candlesticks. You know these candlesticks have something to do with market timing and you could benefit from them, if only you knew how. Here's what candlestick charts are and the significance of one type of candlestick known as a doji.
| Like all forms of technical analysis, candlestick charting attempts to forecast future price movements. These predictions are done based on examination of past behavior, as evidenced by price charts. Graphically depicting price ranges over time provides a visual shortcut that allows the trader to easily assimilate information and, more important, to see patterns. Within those patterns are hidden signals that can indicate when to act to buy, to hold, to sell.
Why charts?There are several assumptions underlying the premise that price charts can help forecast future movements and aid the timing of buy, sell, or hold decisions. First, a technical analyst assumes that the price of a stock (or other tradable instrument) is a meaningful number that represents all relevant information. Another way of saying this is that price discounts everything. Whatever the price is, it sums up all the various factors at play in the market. According to technicians, the price is reflective of all informationtherefore, it makes sense that it forms the basis of analysis. Because of this belief, technicians do not need or want to know about the reasons why the price changes. Unlike fundamentalists those who study a company's fundamentals (capitalization, earnings per share, price/earnings ratio and the like) technicians feel that ultimately, prices change based on the fluctuation of supply and demand. The value of an asset is whatever someone is willing to pay for it and it is not necessary to know why they will pay that amount. Another underlying assumption that chartists make is that price changes are not totally random. Technical analysts believe that prices have a tendency to follow trends, periods where their behavior follows a pattern. Most technicians also agree that prices are not always trending and that certain periods of random fluctuation are interspersed with trending periods. The trick is to determine which activity is happening when. To do this, technicians examine patterns and indicators.
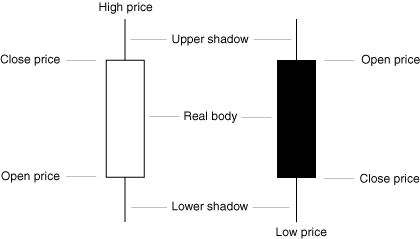
Why candlesticks?A typical bar chart of price movement, which can represent any time frame, usually includes the open, high, low, and close price of the tradable. Some charts may also include volume, or the number of shares traded. A candlestick chart also includes these elements, but depicts them more vividly, using a two-dimensional rectangle called the body to illustrate the trading range between open and close and vertical lines (called shadows) at the top and bottom of the body to depict the high and low price. (See Figure 1.) If the closing price is below the opening price, the body is filled in; when the closing price is above the openng price, the body is empty.
Figure 1: Candlestick body. A candlestick chart uses a two-dimensional rectangle called the body to illustrate the trading range between open and close and vertical lines (called shadows) at the top and bottom of the body to depict the high and low price. If the closing price is below the opening price, the body is filled in. When the closing price is above the opening price, the body is empty.
According to technician and candlestick authority Steve Nison, one of the most powerful advantages of candlesticks over ordinary bar charts is that the size and color of the real body can quickly provide volumes of information. For example, a long white real body indicates the bulls (or optimists) are in charge of the market; whereas a long black real body indicates the bears (pessimists) dominate. Smaller bodies indicate a tug of war is under way between bulls and bears.
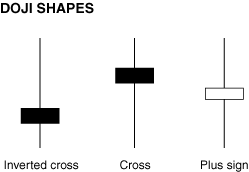
Doji candlesticksCandlesticks are given a variety of descriptive names depending on their size, shape, and color. Some of these names are readily understood, such as the hammer (the real body sits atop a long lower shadow and looks like a hammer or gavel) or shaven head (the body has no upper shadow). Others are more poetic or abstract in their description, such as three black crows, three white soldiers, and shooting star. The term doji refers to a candlestick with a very thin real body (or even a horizontal line). Doji occur when the open and close prices are very similar or even the same. The length of the upper and lower shadows can vary tremendously, so the doji may resemble a plus sign (relatively equal shadows) or a cross or inverted cross (shorter and longer upper shadows, respectively). (See Figure 2.) If there is no upper shadow and a long lower shadow, the doji is called a dragonfly. A long upper shadow with no lower shadow is known as a gravestone.
Figure 2: Doji shapes. The doji candlestick has a thin real body (or even a horizontal line). Doji occur when the open and close price are very similar or the same. The length of the upper and lower shadows can vary, so the doji may resemble a plus sign (relatively equal shadows) or a cross or inverted cross (shorter and longer upper shadows respectively). If there is no upper shadow and a long lower shadow, the doji is called a dragonfly. A long upper shadow with no lower shadow is known as a gravestone.
Significance of dojiDoji candlesticks provide information on their own and also feature in several important candlestick patterns. Because they form when the open and close prices are virtually equal, doji indicate indecision within the market. When doji appear, there is a relatively balanced tug-of-war between buyers and sellers. Alone, doji are neutral patterns. They are more significant when they appear among candlesticks with long real bodies, possibly signaling a turning point in buying or selling pressure. Whether they indicate bullish or bearish tendencies depends on preceding action (and future confirmation). After an advance in price (illustrated by long white candlesticks), the appearance of a doji indicates that the buying pressure is weakening. Conversely, when doji appear following a series of long black candlesticks (indicating price decline), they signal a reduction in selling pressure. Either occurrence may indicate a trend reversal is approaching. Further confirmation of the declining trend may come from a gap down (opening below the previous day's close) or a long black candlestick. Further bullish confirmation may be signaled by a gap up or a long white candlestick following the doji. Dragonfly doji (long lower shadows) indicate that sellers dominated the trading and were able to drive prices lower, but by the end of the session, buyers pushed the price back to the opening (high) level. (See Figure 3.) Depending on prior price action, dragonfly doji may indicate a trend reversal. The long lower shadow demonstrates that buying pressure existed, but the low indicates that plenty of sellers are active. After a long downtrend, a dragonfly might signal a bottom and bullish reversal. After a long period of advances, the dragonfly's long lower shadow might demonstrate the potential for a downswing.
Figure 3: Dragonfly doji. Dragonfly doji (long lower shadows) indicate that sellers dominated the trading and were able to drive prices lower but that by the end of the session buyers pushed the price back to the opening (high) level. Depending on prior price action, dragonfly may indicate a reversal of trend. The long lower shadow demonstrates that buying pressure existed, but the low indicates that plenty of sellers are active. After a long downtrend, a dragonfly might signal a bottom and bullish reversal. After a long period of advances, the dragonfly's long lower shadow might demonstrate the potential for a downswing.
Opposite in appearance to the dragonfly is the gravestone doji, which forms when the open, low, and close prices are near equal and the high price creates a long upper shadow. (See Figure 4.) Gravestone doji appear when buyers dominate the trading and drive prices higher during the session, but the sellers ultimately prevail and push the price back down to the opening level. Again, the implications of gravestone doji depend on previous activity. The close at a low level evidences a failed price rally, but the longer upper shadow demonstrates significant buying pressure during the trading session. When gravestones appear after a downtrend, the buying pressure is deemed significant and a bullish reversal is anticipated. Appearing after an uptrend, the failed rally component of a gravestone is considered relevant and a potential bearish reversal is anticipated.
Figure 4: Gravestone doji. The gravestone doji is the opposite of the dragonfly, and forms when the open, low, and close price are near equal and the high price creates a long upper shadow. Gravestone doji appear when buyers dominate the trading and drive prices higher during the session but the sellers ultimately prevail and push the price back down to the opening level. When gravestones appear after a downtrend, the buying pressure is deemed significant and a bullish reversal is anticipated. Appearing after an uptrend, the failed rally component of a gravestone is considered relevant and a potential bearish reversal is anticipated.
Concluding on candlesticksCandlesticks visually depict price movement in a vivid and concise manner. Once the implications of the various shapes and sizes is understood, candlesticks can provide easily readable signals to the investor. These signals must be understood within the context of prior activity and should be confirmed with other indicators, but are an important tool for determining price trends and potential reversals. Doji candlesticks indicate indecision in the marketa relatively balanced struggle between supply and demandand may signal turning points.
Margaret Austin works at home as a full-time mom and a part-time writer.
Suggested readingNison, Steve [2003]. Japanese Candlestick Charting Techniques, New York Institute of Finance/Simon & Schuster.Current and past articles from Working Money, The Investors' Magazine, can be found at Working-Money.com.
|
PRINT THIS ARTICLE

|

Request Information From Our Sponsors
- VectorVest, Inc.
- Executive Premier Workshop
- One-Day Options Course
- OptionsPro
- Retirement Income Workshop
- Sure-Fire Trading Systems (VectorVest, Inc.)
- Trading as a Business Workshop
- VectorVest 7 EOD
- VectorVest 7 RealTime/IntraDay
- VectorVest AutoTester
- VectorVest Educational Services
- VectorVest OnLine
- VectorVest Options Analyzer
- VectorVest ProGraphics v6.0
- VectorVest ProTrader 7
- VectorVest RealTime Derby Tool
- VectorVest Simulator
- VectorVest Variator
- VectorVest Watchdog
- StockCharts.com, Inc.
- Candle Patterns
- Candlestick Charting Explained
- Intermarket Technical Analysis
- John Murphy on Chart Analysis
- John Murphy's Chart Pattern Recognition
- John Murphy's Market Message
- MurphyExplainsMarketAnalysis-Intermarket Analysis
- MurphyExplainsMarketAnalysis-Visual Analysis
- StockCharts.com
- Technical Analysis of the Financial Markets
- The Visual Investor


