HOT TOPICS LIST
- Strategies
- Stocks
- Buy
- Investing
- Brokers
- Psychology
- Interviews
- Accumulate
- Sell
- Hold
- Spotlight
- Websites
- Candlestick Corner
- Gold & Metals
- Options Trading
LIST OF TOPICS
CANDLESTICK CORNER
Combining Candlesticks And Trendlines
05/27/04 02:58:29 PM PSTby Ashwani Gujral
Previously, I analyzed trendlines and described some of the more common candlestick reversal patterns. This time, I will show you how to use the two together.
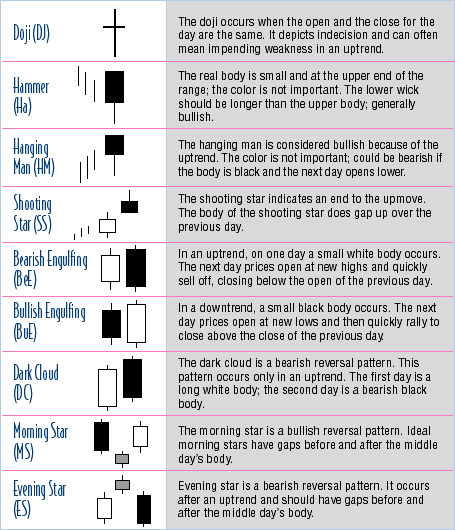
| Traditional technical analysis indicators provide patterns, measurements, and points where a market might find support or resistance. But these patterns sometimes fail, trapping bulls and bears as the market races in unexpected directions. In addition, many of these traditional (Western) indicators lag, and only provide trend confirmation when a significant part of the trend is over. In contrast to the Western indicators, candlestick patterns are a direct reflection of the strength of the buyers and sellers. Candlestick patterns tend to occur frequently, however, and cannot be taken without additional confirmation — often with traditional technical indicators. In this article, I will discuss the use of trendlines with candlesticks. Although I do not discuss volume here, it is important to note that it is a critical factor when looking at trendline breakdowns/breakouts. It would not be incorrect to say that while looking at Western indicators is like looking in the rearview mirror, looking at candlesticks is like looking ahead through the windshield. Candlesticks indicate the possible future price action when a trendline is tested. (For some examples of candlestick patterns and their descriptions, see the table at the end of this article.)
Support and resistance linesSupport and resistance lines connect successive lows or highs. They can be falling, rising, or flat. These lines are important in that they can identify support and resistance on a chart where none would otherwise be apparent. Not only does this facilitate better risk/reward entries, but it also gives great profit objectives. Support and resistance lines work on all time frames and are used by daytraders in particular. When combined with various candlestick patterns, traders can use these tools to gauge the strength of trendlines. But what happens if there is a signal that is not confirmed by both trendlines and candles? This technique is a filter, so in such a case, it would be wisest to ignore the signal.
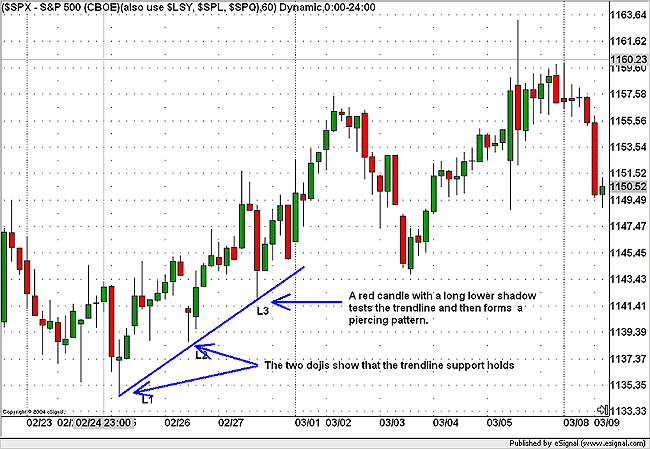
Rising support linesA rising support line is constructed using higher lows. Figure 1 shows how a trendline is drawn once lows L1 and L2 are connected. On the extended trendline, you would wait for a candle to be formed after touching the trendline. On the day the low L3 was made, prices rallied and closed significantly higher than the low. This should alert you that the support on the trendline still holds, but you should wait for a confirmation on the following day. You can see in the chart that the market opened higher and kept gaining throughout the following day. You would go long as the market closes strong on that day. The stop for this trade is placed under the low of the previous day, at or under the trendline by 1%. You still have to wait to see what happens when L3 is made. On the first day, prices touch the low and then rally to close much higher. The next day, prices try to approach L3 but then rally to close almost at the high of the day. You should treat this as the confirmation of the support level, and buy the day after L3 is made.
Figure 1: Rising support line with candlesticks. Note that the trendline support held well at the third touch.
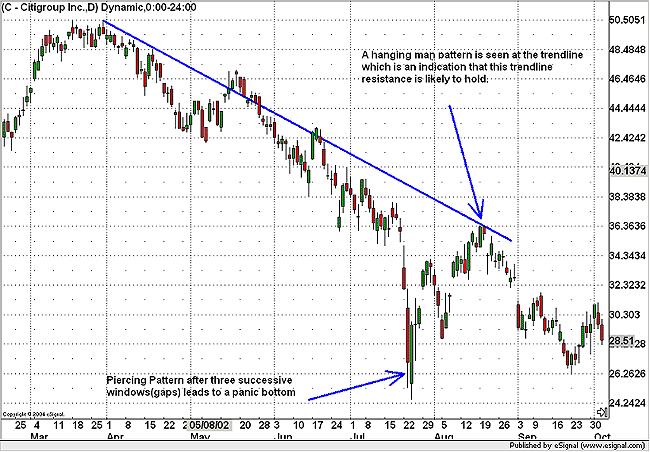
Falling resistance linesA falling resistance line connects lower highs. In Figure 2, the downtrend steepens and becomes a free fall, with three consecutive gaps down at the open. Traders can go long at this emotional low and ride it up to the trendline. As the price reaches the trendline, a bearish hanging man formation appears, which indicates that profits should be booked; the move is likely to face strong resistance at this point.
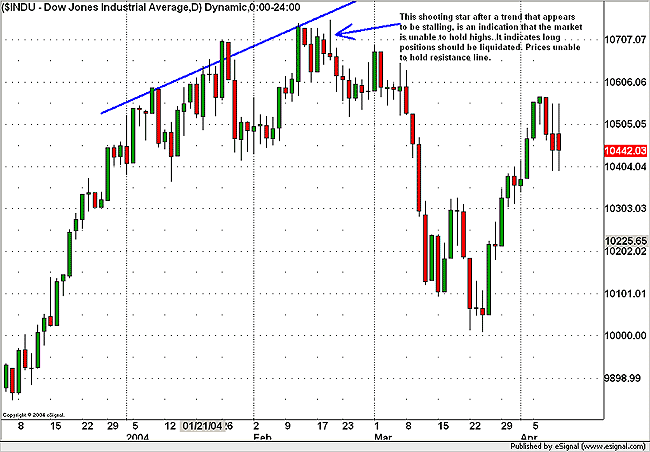
Figure 2: Falling support line with candlesticks. The downward-sloping trendline held well and is likely to continue. Rising resistance lines A rising resistance line joins higher highs and indicates levels where the trend may stall. As you can see in Figure 3, prices hit the rising resistance line twice. Note the doji patterns close to the trendline. After flattening out, prices proceeded to rally and stall when they approached the trendline. The shooting star was an indication that prices were not going to break out of the resistance level. This is a signal to take profits.
Figure 3: Rising resistance line. When price is unable to hit the resistance levels, it's an indication that positions should be liquidated.
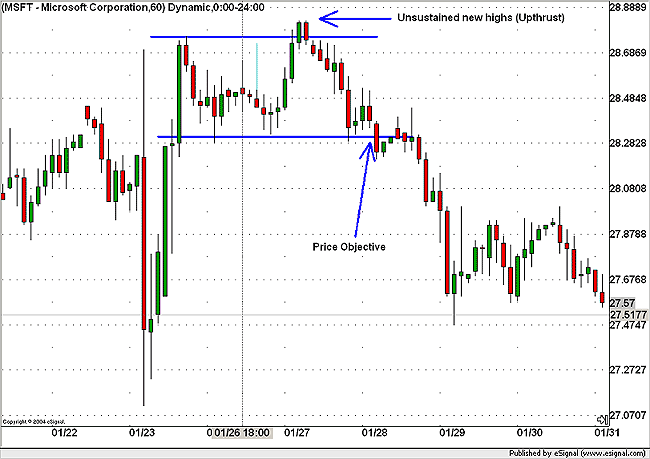
UpthrustsUpthrusts are false breakouts to the upside from a range, after which the price comes crashing down (see Figure 4). Theories abound about why this pattern occurs. One reason may be that the "smarter" players in the market lead the retail traders to believe that a genuine breakout has occurred. As soon as these retail traders take positions, the institutional and large traders take the market in the other direction, taking out their stop-losses as well. But smaller traders do not realize the breakout is false until the market comes crashing back down. This is why strict stop-losses should be the order of the day. You can look at the volume, but that sometimes does not give the exact picture, because these days volume can include arbitrage trading as well. Since up to 70% of breakouts can be false, you should always expect false breakouts. Once a short position is taken on a false breakout, it generally needs a very small stop-loss, since positions do not retest the high again. This is because the trapped traders on the long positions rush to cut positions, making the market come down with force. However, candlestick patterns can sometimes warn of false breakouts, as shown in Figure 4. Here, a bearish engulfing pattern forms and leads to a huge move down. Ideally, you would go short below the downward candle of the bearish engulfing pattern.
Figure 4: Breakouts. Don't get fooled by false breakouts such as this one.
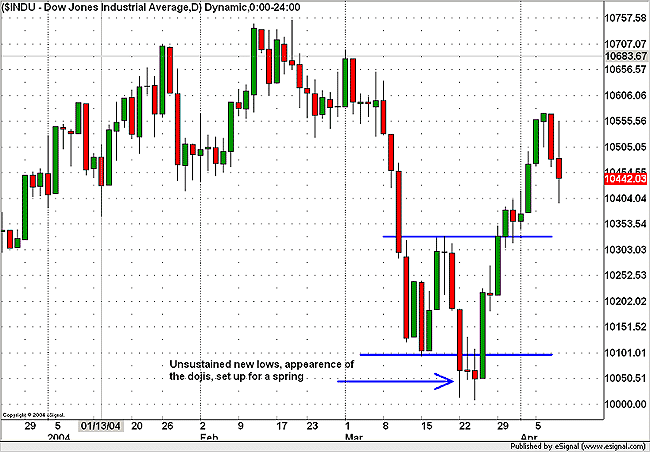
SpringsSprings are the opposite of upthrusts. First comes a false breakdown from a range, and then the market is taken up with great force. Retail traders may believe that the market is breaking down, but it is really going up. However, candlesticks can play a role in warning traders of a spring. As the market breaks down from the range in Figure 5, you can see a doji. This is an indication that the downtrend is unsustainable. Thus, traders can go long above the high of the doji pattern outside the range.
Figure 5: Springs. Here's an example of a typical false breakdown. The doji indicates that the downtrend is unsustainable.
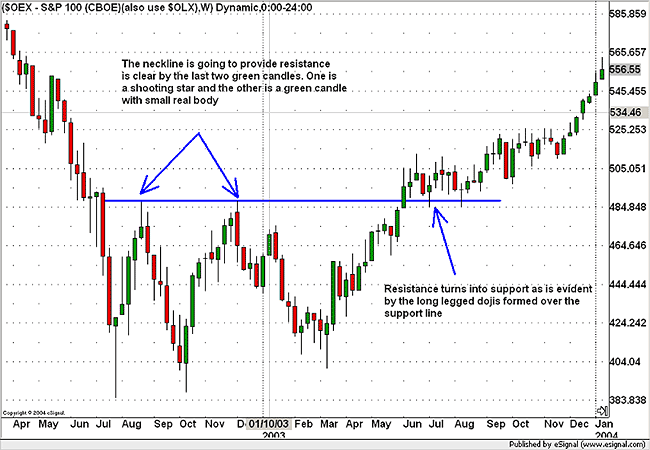
The change of polarity principleFigure 6 illustrates the "change of polarity principle," as Steve Nison discusses in his Japanese Candlestick Charting Techniques. "Change of polarity" refers to the process through which support levels can become resistance levels and resistance levels can become support levels. A support (resistance) level that has held the market at least twice is likely to provide resistance (support) to the pullback rally after a breakdown (breakout). Candlesticks confirm this retest of the new resistance (support) as a target for the pullback rally (decline) and a point for taking fresh short (long) positions.
Figure 6: Change of polarity. What was once a resistance level became a support level after prices broke out above the neckline.
In Figure 6, you can see a head & shoulders bottom with a neckline. On two occasions, the neckline offers resistance; a shooting star and a bearish engulfing pattern appear each time the price tests the neckline. On the third attempt, price breaks out of the neckline and forms a series of doji patterns, which remain above the neckline. Any trader who is long from the bottom of the right shoulder should have taken profits when the trend stalled and should have reentered when prices broke out above the dojis. Once the breakout from the series of dojis occurs, this neckline becomes the support level. A stop-loss can be set below this level.
SummaryTrendlines and candlesticks complement each other and provide powerful trading signals. While trendlines help in following the trend, candlesticks offer excellent buying and selling signals along that trend. This is especially true in the extreme zones (overbought or oversold) of many Western technical indicators, as well as at trendline support and resistance levels. Filtering candlestick patterns with trendlines makes them even more powerful tools, and fills the gap between Eastern and Western technical analysis.
Ashwani Gujral is an India-based technical analyst, commentator, author, and trainer. He follows both Indian and US markets. He is an active short-term trader and money manager.
Suggested readingEdwards, Robert D., and John Magee [2001]. Technical Analysis Of Stock Trends, 8th ed., W.H.C. Bassetti, ed. Saint Lucie Press.Gujral, Ashwani [2004]. "Candlesticks And Trendlines," Working Money: May 12. Nison, Steve [1991]. Japanese Candlestick Charting Techniques, New York Institute of Finance/Simon & Schuster. Charts courtesy eSignal
Current and past articles from Working Money, The Investors' Magazine, can be found at Working-Money.com.
|
PRINT THIS ARTICLE

|

Request Information From Our Sponsors
- StockCharts.com, Inc.
- Candle Patterns
- Candlestick Charting Explained
- Intermarket Technical Analysis
- John Murphy on Chart Analysis
- John Murphy's Chart Pattern Recognition
- John Murphy's Market Message
- MurphyExplainsMarketAnalysis-Intermarket Analysis
- MurphyExplainsMarketAnalysis-Visual Analysis
- StockCharts.com
- Technical Analysis of the Financial Markets
- The Visual Investor
- VectorVest, Inc.
- Executive Premier Workshop
- One-Day Options Course
- OptionsPro
- Retirement Income Workshop
- Sure-Fire Trading Systems (VectorVest, Inc.)
- Trading as a Business Workshop
- VectorVest 7 EOD
- VectorVest 7 RealTime/IntraDay
- VectorVest AutoTester
- VectorVest Educational Services
- VectorVest OnLine
- VectorVest Options Analyzer
- VectorVest ProGraphics v6.0
- VectorVest ProTrader 7
- VectorVest RealTime Derby Tool
- VectorVest Simulator
- VectorVest Variator
- VectorVest Watchdog

