HOT TOPICS LIST
- Strategies
- Stocks
- Buy
- Investing
- Brokers
- Psychology
- Interviews
- Accumulate
- Sell
- Hold
- Spotlight
- Websites
- Candlestick Corner
- Gold & Metals
- Options Trading
LIST OF TOPICS
CANDLESTICK CORNER
Candlesticks And Trendlines
05/12/04 04:01:55 PM PSTby Ashwani Gujral
You can use them together. Here's how.
| On any time frame, traders face a number of possibilities when a price approaches a trendline. The price could be trending up or down or be in a trading range. Traders often attach a lot of importance to breakout and breakdowns and prices testing a trendline. The questions that the trader faces when the price nears a trendline are:
Trendlines may be rising, falling, or moving horizontally, in which case they are support and resistance lines. They can be make- or breakpoints on the chart and are areas where the bulls and bears are matched evenly. Finally, bulls or bears break down or break out ̶ but how do you know which one? Candlesticks could give you the answer. Candlesticks often provide clear indications on whether a reversal or a continuation of the trend may be expected. Candlesticks, however, are unable to provide price objectives or targets, but western technical indicators can. By using a convergence of candlesticks and trendlines, you get a better picture of price behavior near important trendlines and an idea of price objectives of any given move. In this article, I first discuss the benefits and rules regarding the trendlines, followed by a study of candlestick reversal patterns.
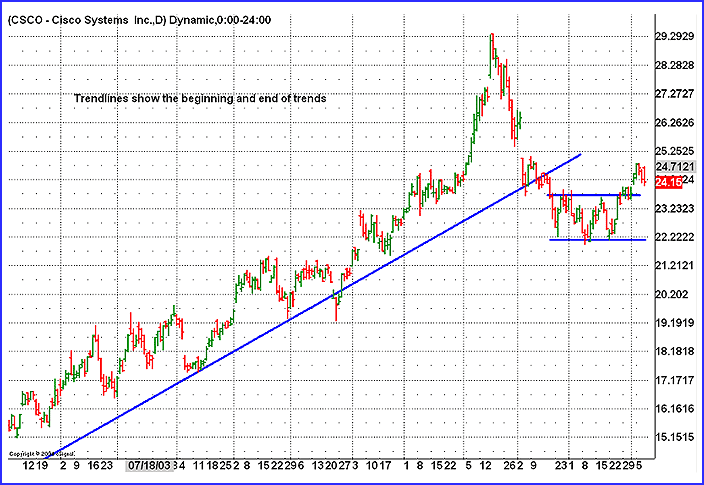
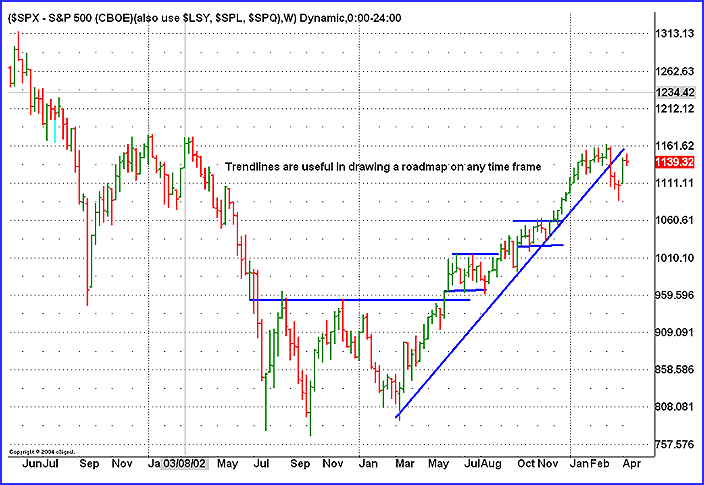
Using trendlinesAs the name suggests, trendlines are used to identify the presence of a trend, the breakdown or breakout of which suggests reversal of an existing trend. There aren't too many traders who don't use some form of trendlines. This makes them an important tool to understand so they can be used in more innovative ways. Trendlines are very simple and very handy, and if they are applied correctly, they can greatly ease the burdens of your trading life. The trendline can be used on any chart: yearly, quarterly, monthly, weekly, daily, 60 minutes, or five minutes, and on any chartable price/data series (see Figures 1 and 2).
Figure 1: Trendlines in Cisco Systems (CSCO). Here you see how trendlines can be used to show the beginning and end of trends.
Figure 2: S&P 500. Trendlines are useful in drawing a roadmap on any time frame.
Certain rules must be followed while drawing trendlines, which are as follows:
Even though trendlines may appear to meet all the criteria, it is important to look for other information that substantiates a new trend. This could be any number of factors such as classical chart patterns on the current time frame, or market action on a longer time frame. One of the key tools that provide forewarning of the behavior of the trendline in the same time frame are candlesticks.
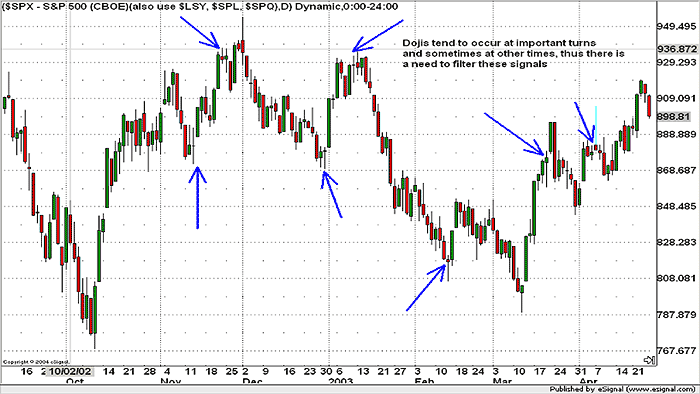
About reversalsA reversal in market psychology precedes a trend reversal. A reversal in trend is not necessarily a change from downtrend to uptrend or uptrend to downtrend; it could be a move to a sideways market that precedes a reversal in direction. A stall in an ongoing trend often produces sharp whipsaws, which can end up eating part of the profits earned in the previous trend. So it is important to be aware of the possibility of a stall, and candlestick reversal patterns can indicate a change in market psychology or stalls in trends. As in the case of other technical indicators, you cannot often conclude much from only a candlestick reversal pattern on a chart. It is important to look for either a convergence with western indicators like overbought and oversold oscillators or with basic trader tools like the trendline to filter the candle signals. One very important candlestick is the doji, a candlestick formation where the open and close are approximately the same. A doji invariably occurs whenever a trend stalls or a reversal is imminent. The doji represents the concept that the bulls and bears are evenly matched and there is indecision with regard to the trend. It is important to remember that a doji is not a trading signal, but a warning that the technical position of the market or stock may be changing (Figure 3).
Figure 3: Here is the appearance of doji at turning points.
All dojis need confirmatory candles to act as a trading signal for a fresh move. Traders would do well to look for a doji at extreme zones of western indicators or at significant trendlines and use them for expecting a reversal in market psychology and taking profits. In my trading experience, while exiting on a doji formation might not protect your entire move, it makes it worthwhile to book profits over the long run whenever a doji occurs after a substantial move, either up and down. This is because in a majority of cases, the doji leads to trends stalling and reversals, both minor and major. In my next article, I will provide examples of how candlestick patterns can be used in conjunction with trendlines.
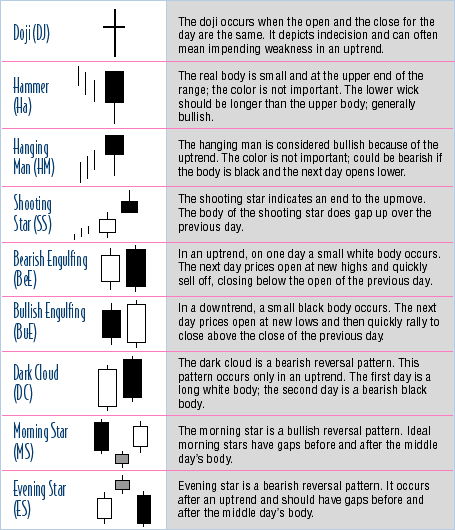
Figure 4: Here are some important candlestick reversal patterns.
Ashwani Gujral is an India-based technical analyst, commentator, author, and trainer. He follows both Indian and US markets. He is an active short-term trader and money manager.
Related readingNison, Steve [1991]. Japanese Candlestick Charting Techniques, New York Institute of Finance/Simon & Schuster._____ [1994]. Beyond Candlesticks, John Wiley & Sons.
Charts courtesy eSignal
Current and past articles from Working Money, The Investors' Magazine, can be found at Working-Money.com.
|
PRINT THIS ARTICLE

|

Request Information From Our Sponsors
- VectorVest, Inc.
- Executive Premier Workshop
- One-Day Options Course
- OptionsPro
- Retirement Income Workshop
- Sure-Fire Trading Systems (VectorVest, Inc.)
- Trading as a Business Workshop
- VectorVest 7 EOD
- VectorVest 7 RealTime/IntraDay
- VectorVest AutoTester
- VectorVest Educational Services
- VectorVest OnLine
- VectorVest Options Analyzer
- VectorVest ProGraphics v6.0
- VectorVest ProTrader 7
- VectorVest RealTime Derby Tool
- VectorVest Simulator
- VectorVest Variator
- VectorVest Watchdog
- StockCharts.com, Inc.
- Candle Patterns
- Candlestick Charting Explained
- Intermarket Technical Analysis
- John Murphy on Chart Analysis
- John Murphy's Chart Pattern Recognition
- John Murphy's Market Message
- MurphyExplainsMarketAnalysis-Intermarket Analysis
- MurphyExplainsMarketAnalysis-Visual Analysis
- StockCharts.com
- Technical Analysis of the Financial Markets
- The Visual Investor


