HOT TOPICS LIST
- Strategies
- Stocks
- Buy
- Investing
- Brokers
- Psychology
- Interviews
- Accumulate
- Sell
- Hold
- Spotlight
- Websites
- Candlestick Corner
- Gold & Metals
- Options Trading
LIST OF TOPICS
TRADER'S NOTEBOOK
Do P/E Ratios Really Matter?
04/14/04 04:10:41 PM PSTby Matt Blackman
Everyone has an opinion about price to earnings ratios. When are they too low, too high, or just right? Would a P/E ratio indicator help the trader outprofit the buy-and-hold investor over the long haul?
| In a Stocks & Commodities interview in April 1994, investor James B. Stack commented that market valuations, including price/earnings ratios, were at their highest point in history. He used this metric, together with a number of sentiment indicators, to opine that the correction taking place in the market was probably going to turn into a bear market. The Standard & Poor's 500 P/E was in the process of surpassing its previous high of 24, which was set back in 1966 — just before the beginning of a bear market that was to last until 1982. At the time of the interview, the Dow Jones Industrial Average (DJIA) was trading in the area of 3600. As we know now, that was just a pause. The ratio continued to rise, running into the mid-40s and taking the DJIA more than 300% higher to nearly 12,000 before the bears finally came out of hibernation en masse in 2001. Stack is not the first analyst in history to take miscues from absolute valuations. As P/Es continued to hit new highs between 1995 and 2000, more than one analyst declared that the ratio was no longer relevant thanks to the birth of the new economy. Investors were repeatedly told to ignore valuations and invest for the long term. This turned out to be dubious advice at best for those who bought near the top in 2000 and lost hand over fist in the ensuing two years. Did that market meltdown have a dramatic effect on investor strategy? This would seem logical, but reality tells a different tale. A Yale University survey conducted between 1996 and 2003 asked respondents how they felt about the following statement: "The stock market is the best investment for long-term holders, who can just buy and hold through ups and downs in the market." It is no surprise that 96% of respondents agreed either "strongly" or "somewhat" with the statement in 1999, after 17 years of the longest-running bull market in history. However, what is surprising is that in 2003, 83% still agreed, either strongly or somewhat — after the market had experienced more than two years of heavy losses. According to Alan M. Newman, editor of Longboat Global Advisors' Crosscurrents newsletter, total market capitalization for the Standard & Poor's 500 index of companies peaked in 1999-2000 somewhere around $18.65 trillion. Within the space of a little more than two years, market capitalization dropped by more than half, hitting a low of approximately $9.18 trillion in 2002. That's a loss equal to more than 95% of the total US GDP for that year! Along with that loss went the hard-earned gains and/or savings of many hapless investors. Old habits die hard, even after such a painful experience. Do investors desperately hang on to the buy-and-hold habit because they believe they have no other viable options?
Buy-and-holdWith this question in mind, I decided to do some research. I examined a buy-and-hold approach based on DJIA values from 1920 through year-end 2003. The DJIA increased from 107.23 on January 30, 1920, to 10,488.1 on January 30, 2004, which works out to a mean rate of return of 5.47% per year. This figure did not include dividend income. That's a respectable return, considering the times that the investor had to wait through bear markets and some significant drawdowns for the bull to return. Would a system in which a trader entered and exited the market have fared any better?
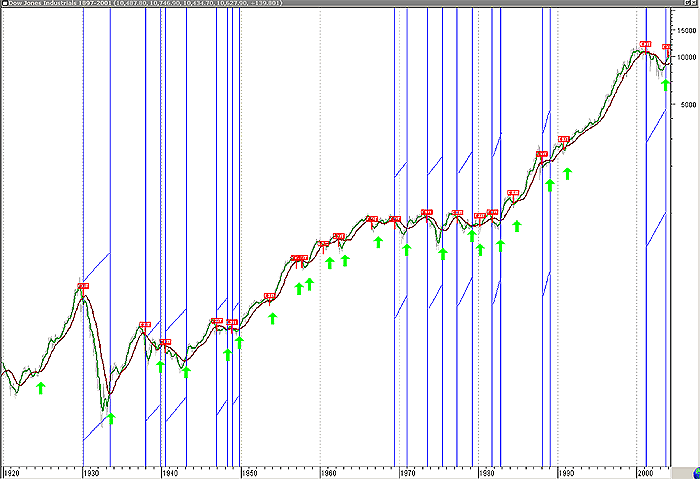
A DJIA trader testTo explore this idea, I tested a simple moving crossover system on the DJIA. A buy was generated when the shorter-period signal line crossed above a longer-period base line. The position was exited when the signal line crossed below the base line. I tried a number of periods and determined that a good combination was a five- and 21-month simple moving average (SMA) crossover. The first signal in the 1920-2004 period occurred in October 1924. In all, a total of 22 buy signals and 21 exits were generated up to January 2004. The last trade was exited with the termination of the test on January 30 (see Figure 1).
Figure 1: Monthly chart of the Dow Jones Industrial Average (DJIA) during the same period as Figure 1 (1920 to January 30, 2004) showing the results of a five- and 21-month simple moving average crossover system to buy and sell. Again, a total of 22 buy and sell signals were generated, with the last buy generated in November being terminated at the end of the test. Vertical blue lines with diagonals represent periods of a year or longer in which the trader would have been out of the market.
How did the DJIA trader do? With an initial value of 104.88 and final value of 10,574.22, his mean rate of return was 9.33% per year while in the market. He would have been in the market a total of 49.8 years. This yield did not include any returns earned while his money sat idle when he was out of the market, which totaled 34.2 years, or any dividends paid by Dow index companies. Even so, this was a 70% improvement over the buy-and-hold.
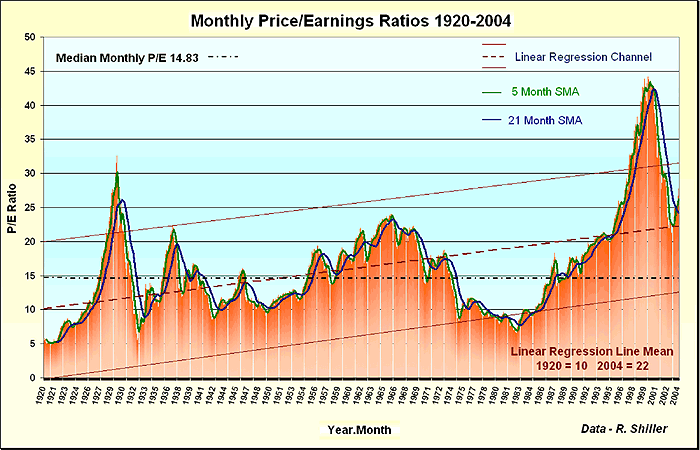
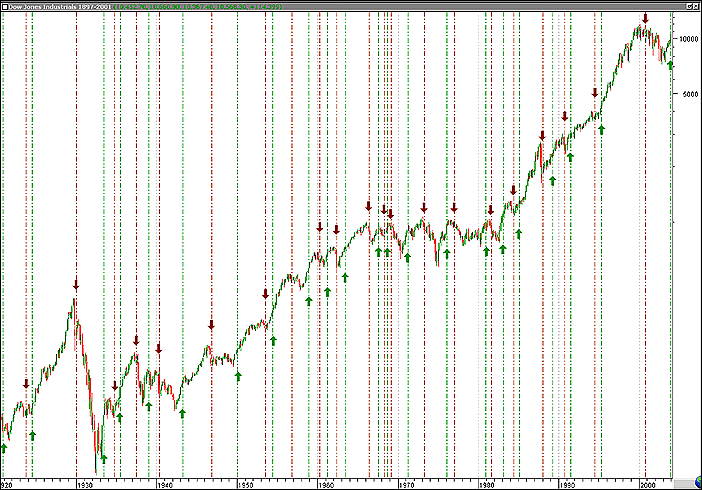
S&P P/E traderNext, I tried a similar system to enter and exit the market, but this time I employed P/Es for the signals. Our hypothetical P/E trader used trailing 10-year S&P 500 P/E ratio data from Robert Shiller, Yale professor and author of the best-selling book Irrational Exuberance. A five- and 21-month SMA were again employed to enter and exit the market. A total of 22 buy and 21 exit signals were generated. This test resulted in a lower gross return than both the buy-and-hold and the DJIA crossover methods, with a profit during the period of 9,296.86 Dow points (see Figures 2 and 3). The P/E trader was also in the market the least amount of time at 530 months or 44.2 years. His mean rate of return was the best for time spent in the market at 10.13% per year for an improvement over the buy-and-hold of more than 85%. This also assumed that he earned zero returns while out of the market for 39.8 years, and like the two other tests, did not include dividend income (see Figure 4).
Figure 2: Monthly chart of trailing 10-year S&P 500 (and precursors) P/E ratios between 1920 and January 2004. A total of 22 buy and sell signals were given using a five- and 21-month simple moving average crossover. The historical median P/E ratio was 14.83, and the linear regression mean that started at 10 in 1920 was 22 by early 2004. Extreme P/Es are generally followed by at least two decades of lower valuations, which in the past have declined below 10 before a new secular bull started again. Note the last buy signal generated in November 2003, which would have remained open had the test not been terminated.
Figure 3: Monthly chart of DJIA. The chart shows 22 buys and exits for the P/E ratio trader, who entered the market when the five-month crossed above the 21-month SMA on the P/E chart in Figure 2 and exited when it crossed below.
Figure 4: Comparison summary
Short-sellingWould the S&P P/E trader have been better off exiting a long trade when a sell signal was given and entering the same-size trade on the short side? Had he done this for each of the 21 sell signals given, he would have lost a total of 1159 points between 1920 and 2003, which works out to an average loss of 55 DJIA points per trade. The winning short trades in 1930-33 and 2001-03 would have been more than offset by the large number of losing short trades between these periods. The major benefit of a simple moving average crossover system was therefore not in telling the trader when to go short, but rather in getting him or her out of the market and thereby avoiding periods of negative or lackluster returns. A glance at both the DJIA and S&P P/E charts reveal a clear overall uptrend that dominated the markets from 1920 to 2003. A simple visual inspection of the charts tells us that taking longer-term short trades (using a monthly period SMA crossover system) would have been counter to this trend, and therefore inadvisable. This conclusion is supported by the test results.
Le grande differenceFrom the standpoint of gross returns, the DJIA trader did best with a return over the period of 10,574.22 Dow points, or 1.9% better when compared to a gross return of 10,380.87 points for the buy-and-hold investor. With a gross gain of 9,296.86 over the same 84-year period, the S&P P/E trader showed the least overall gain, lagging behind the winner by 12%. But these results ignore a major component in computing investment returns: time. Using a relatively simple system of moving average crossovers to enter and exit the market, both traders substantially outperformed the buy-and-hold investor for the time spent in the market. The S&P P/E trader avoided the largest index meltdowns and was out of the market when valuations, and stock values, declined. The P/E trader outperformed the DJIA trader because index price increases caused the ratio value to change more rapidly when using trailing 10-year earnings rather than independent index prices. However, we did not find that signals were consistently generated more quickly. In fact, the trades often did not span the same periods. In instances where trades occurred in close proximity timewise, the P/E ratio signal got traders into the market a month earlier. However, this was not always the case. More work will be needed to determine the exact reason for the improvement, but the important point here is that S&P P/Es did provide better signals than using DJIA values. The P/E trader enjoyed an 85% improvement in returns over a buy-and-hold strategy for actual time spent in the market, and fared nearly 15% better than the DJIA trader. Bear in mind, though, the error factor is 15% with only 43 trades. (Error is equal to 1 divided by the square root of the number of trades.) Basically, this means we can be 85% confident in our results, but need more trades to have a higher degree of confidence. It is also important to remember that no returns were earned in our tests for time not in the market. A simple method of buying US Treasury or long-term bonds when not in the stock market would have easily doubled the return of the DJIA and S&P P/E traders over the buy-and-hold investor. The tests demonstrated that even in the overall uptrend that has existed since 1920, many times the investor is better off being out of the market and free from risk. In addition, they showed that it is not absolute price or P/E values that matter. It is the rate of change in P/E values, using the relative differences between two moving averages as a metric. The best times to be in the market are when values are increasing. But the challenge is in finding the "Goldilocks" metric that keeps you in when the market is just right, but gets you out when the market is cooling. A five- and 21-month moving average worked quite well. Future testing may provide a better combination (or a different system altogether). Since 1920, linear regression analysis tells us that linear regression mean P/Es have gone from 10 to 22. The regression channel clearly demonstrates the uptrend. Knowing the mean P/E value of 14.83 is not nearly as important. It is more useful to know the recently weighted or linear regression mean. The question is, will this trend continue upward?
Last wordThe only reason that buy-and-hold strategies continue to attract a multitude of followers is because the majority have found a return of 5.47% per annum, a rate at which a market participant doubles his money every 13 years — perfectly acceptable. But what if we enter a period in which markets show a downward bias for 20 years? When this occurs, or when we experience an extended trading range-bound market in which the DJIA remains virtually unchanged for a number of years, a more technical approach will attract an increasing number of disenfranchised buy-and-hold market participants. Last but not least, these tests demonstrate that P/E values really do matter, and can be especially useful for those who know how to apply them effectively.
Matt Blackman is a trader, technical analysis, software reviewer, and content provider for technical trading/investment publications and websites. He is an affiliate member of the Market Technicians Association (MTA) and Canadian Society of Technical Analysts (CSTA), and is currently enrolled in the Chartered Market Technicians (CMT) program. He may be reached at trader@goldhaven.com.
Current and past articles from Working Money, The Investors' Magazine, can be found at Working-Money.com.
|
Matt Blackman is a full-time technical and financial writer and trader. He produces corporate and financial newsletters, and assists clients in getting published in the mainstream media. He tweets about stocks he is watching at www.twitter.com/RatioTrade Matt has earned the Chartered Market Technician (CMT) designation.
| E-mail address: | indextradermb@gmail.com |
PRINT THIS ARTICLE

|

Request Information From Our Sponsors
- StockCharts.com, Inc.
- Candle Patterns
- Candlestick Charting Explained
- Intermarket Technical Analysis
- John Murphy on Chart Analysis
- John Murphy's Chart Pattern Recognition
- John Murphy's Market Message
- MurphyExplainsMarketAnalysis-Intermarket Analysis
- MurphyExplainsMarketAnalysis-Visual Analysis
- StockCharts.com
- Technical Analysis of the Financial Markets
- The Visual Investor
- VectorVest, Inc.
- Executive Premier Workshop
- One-Day Options Course
- OptionsPro
- Retirement Income Workshop
- Sure-Fire Trading Systems (VectorVest, Inc.)
- Trading as a Business Workshop
- VectorVest 7 EOD
- VectorVest 7 RealTime/IntraDay
- VectorVest AutoTester
- VectorVest Educational Services
- VectorVest OnLine
- VectorVest Options Analyzer
- VectorVest ProGraphics v6.0
- VectorVest ProTrader 7
- VectorVest RealTime Derby Tool
- VectorVest Simulator
- VectorVest Variator
- VectorVest Watchdog


