

HOT TOPICS LIST
- Strategies
- Stocks
- Buy
- Investing
- Brokers
- Psychology
- Interviews
- Accumulate
- Sell
- Hold
- Spotlight
- Websites
- Candlestick Corner
- Gold & Metals
- Options Trading
LIST OF TOPICS
CANDLESTICK CORNER
Anatomy Of A Candlestick
09/17/03 09:27:42 AM PSTby Clive Lambert
Take a closer look at this strong reversal pattern.
| I have been writing daily analysis on the futures markets for five years now, and over this period I have also started to teach various groups about technical analysis methods. One method of growing interest among futures traders is candlestick analysis, as championed by Steve Nison in his book Japanese Candlestick Charting Techniques. I have noticed that although people end up with a few candlestick patterns that stick in their minds, they don't quite grasp why a specific candlestick pattern is a reversal, a continuation, or anything else, for that matter. I have been working in the futures market for quite a while, first as a broker and later as a commentator on current or recent market action. For this reason my approach to candles may have been slightly different from the norm, in that I was already aware of the price action that leads to the formation of patterns. This made it much easier for me to understand the reasoning behind certain candlestick patterns, particularly reversals. Let's take a look at one of these patterns, the hammer.
THE HAMMERTaking a daily candlestick pattern and having a quick look at the intraday (say, 10-minute) chart instantly gives you perspective and makes understanding the patterns that much easier. I thought I'd illustrate this with the hammer, since it's one of the simpler candle reversal patterns.
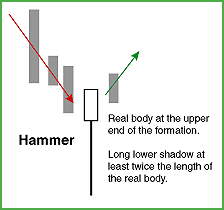
For those of you who are new to candlesticks, or who may be a little rusty, here is the basic set of rules that apply to the hammer pattern:
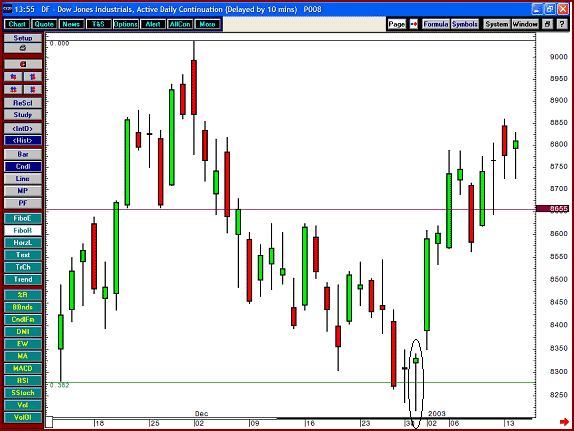
Now let's look at a couple of charts. Figure 1 is a chart for the Dow Jones futures between November 13, 2002, and January 14, 2003. You can see that the market sold off sharply between December 2 and the end of the year, culminating with a session on the last day of 2002 that complied with the rules. Thus, we have our hammer. This was a strong signal to go long.
Figure 1: The hammer as a reversal.
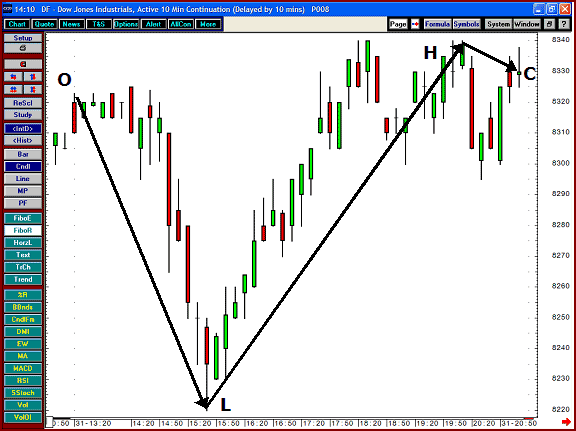
This was a hammer pattern, and it worked well. Why? First, let's get a grasp on that hammer session by looking at the 10-minute chart for that day, illustrated in Figure 2. It's pretty clear from the chart what went on that day, but let's just go through it anyway: The market opened at 8320, traded down to 8220, then rallied, trading up to 8340 before finishing the session at 8331.
Figure 2: An intraday look at what happened on the day the hammer formed.
Remember that up until this day the market had spent the last month trading down. There hadn't been much good news for the bulls up until this point, had there? But on that day they fought back! The market dropped 100 points, but the bulls stopped the decline. Not only that, but they kept buying it until we got above the open — and even made a new high for the day. They kept the momentum going as well, making sure the close was up near the high of the day. Victory to the bulls!
SUPPORT AND RESISTANCEBut there's more to this particular session than meets the eye, and this is where candlesticks can be combined with basic support and resistance analysis. Going into that day we had a key support level at 8280, which had been breached on December 27, 2002. However, this breach was only slight (we closed at 8270 that day), so we were looking for further confirmation. This failed to appear the next day (December 30) when the market closed at 8307 after having put in a low at 8237. So we had two very strong levels at 8280 and 8237 that the bears took us through on the day the hammer formed. But they missed their chance when the bulls stepped up to the plate, saying "No, you don't!" to the bears' attempts to smash through these key supports. The next day was a great example of a confirming day. Candlestick patterns, like anything else, are fallible, but you get a lot more confidence if the next day sees a continuation of the upward direction seen in the latter half of the hammer day. Now we can see that a hammer is formed because of a paradigm shift in the balance between bulls and bears over the course of a trading session. We were in a market where the bears were in control, but on this day the bulls reentered the fray and made sure they were going to come out on top — quite a change from what went on before. So a hammer is a day where we see a selloff followed by a rally, which is how we get our small real body and long lower shadow. It all seems so simple when put into this context, but I've seen people's faces light up so many times when the pattern is explained in this way. That in turn makes my face light up — living proof that candlestick analysis can light the way!
Clive Lambert, founder of FuturesTechs, writes daily technical analysis on the world's leading financial futures markets. He can be reached at clive@futurestechs.co.uk.
Current and past articles from Working Money, The Investors' Magazine, can be found at Working-Money.com.
|
| E-mail address: | clive@futurestechs.co.uk |
PRINT THIS ARTICLE

Request Information From Our Sponsors
- StockCharts.com, Inc.
- Candle Patterns
- Candlestick Charting Explained
- Intermarket Technical Analysis
- John Murphy on Chart Analysis
- John Murphy's Chart Pattern Recognition
- John Murphy's Market Message
- MurphyExplainsMarketAnalysis-Intermarket Analysis
- MurphyExplainsMarketAnalysis-Visual Analysis
- StockCharts.com
- Technical Analysis of the Financial Markets
- The Visual Investor
- VectorVest, Inc.
- Executive Premier Workshop
- One-Day Options Course
- OptionsPro
- Retirement Income Workshop
- Sure-Fire Trading Systems (VectorVest, Inc.)
- Trading as a Business Workshop
- VectorVest 7 EOD
- VectorVest 7 RealTime/IntraDay
- VectorVest AutoTester
- VectorVest Educational Services
- VectorVest OnLine
- VectorVest Options Analyzer
- VectorVest ProGraphics v6.0
- VectorVest ProTrader 7
- VectorVest RealTime Derby Tool
- VectorVest Simulator
- VectorVest Variator
- VectorVest Watchdog