HOT TOPICS LIST
- Strategies
- Stocks
- Buy
- Investing
- Brokers
- Psychology
- Interviews
- Accumulate
- Sell
- Hold
- Spotlight
- Websites
- Candlestick Corner
- Gold & Metals
- Options Trading
LIST OF TOPICS
THE CHARTIST
Point & Figure Moving Averages
08/26/03 01:23:14 PM PSTby Rudy Teseo
Here's an instance where two are better than one.
| Point and figure (P&F) charting has always been touted as a stand-alone charting technique, requiring no other indicators nor any other confirmation. But it's always good to have confirmation, and to that end, here's a customized simple moving average (SMA) that may be useful. Because P&F is unique in that it has no linear time base (days, weeks, or months), our plain-vanilla SMA will not work. This is because the standard simple moving average is based upon a time period (days, weeks, or months) that fits the standard bar (or candlestick) charts beautifully. Without a linear time base, however, a simple moving average overlay on a P&F chart would have no relationship to the changing price pattern of the plotted Xs and Os in which Xs denote a rise in price and Os a decline. The input to a moving average formula is normally the close of the bar (day, week, or month), although the high or low may be used if desired. To construct the SMA, we will use the midpoint of the P&F column, which is analogous to the midpoint of a conventional daily or weekly bar. A conventional MA is constructed by adding together the observations over the period desired and dividing the sum by the number of observations. We will follow the same procedure to construct our P&F simple moving average. The first step is to enter the indicator builder of our charting program. If the program allows the construction of customized indicators, it will usually have a "paste function" utility. Here are two examples: In SuperCharts, the moving average function is AVERAGE (PRICE, PERIOD). Normally, for PRICE you would enter H, C, or L. We will enter (H+L)/2 (the midpoint of the column). For PERIOD we will enter 5 for one average, and 10 for the other. In MetaStock, the moving average function is MOV ( DATA ARRAY, PERIOD, S, E). For DATA ARRAY we will enter (H+L)/2, for PERIOD we will enter 5 or 10, and S for simple. Finally, we will overlay our P&F chart with the two simple moving averages we've just constructed. We will also change the standard three-box P&F reversal to a one-box reversal. This provides a greater array of Xs and Os for a more accurate display of the moving averages. Since I chose a one-box reversal, I chose five- and 10-period moving averages for my trials. (I have not yet experimented with three-box reversals. If you do, I'd appreciate an email with your results.)
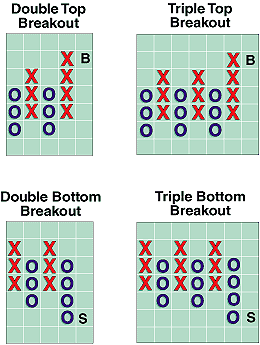
BUY AND SELL SIGNALSThe literature on P&F charting recognizes eight common buy signal patterns and eight common sell signal patterns, plus many less than common ones. In Figure 1 you see two of the most common buy and sell patterns, which also have the highest percentage profitability history (bullish = 80-88%; bearish = 82-93%).
Figure 1: Most common buy and sell patterns in P&F charting
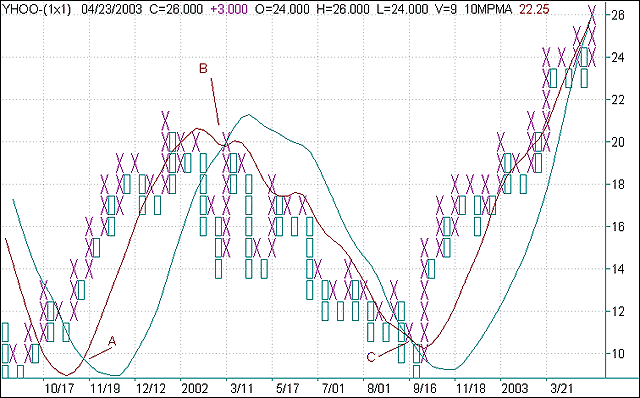
Following the occurrence of one of these patterns, however, there is no indication of how long the new trend will continue, nor when it might reverse. We would hope, therefore, that the moving average will give the trader a heads-up. One of the most common uses of two moving averages is the crossover of the fast (5C) and the slow (10C) moving average. A crossover of the fast average over the slow average upward is a buy signal; the crossover downward is a sell signal. Figure 2 is a chart of Yahoo, Inc. (YHOO). Examination shows that the moving average buy signal at point A occurs at a price of 10, whereas the P&F buy signal (double-top breakout) occurs at a price of 15. The MA sell signal at point B occurs at a price of 20, whereas the P&F sell signal (double-bottom breakout) occurs at a price of 17. The next crossover at point C would have prompted a buy at a price of 10, whereas the next buy signal (again, a double-top breakout) occurred at a price of 12.
Figure 2: P&F MA signals vs. P&F signals. Note how the P&F MA signals get you in and out of a trade earlier.
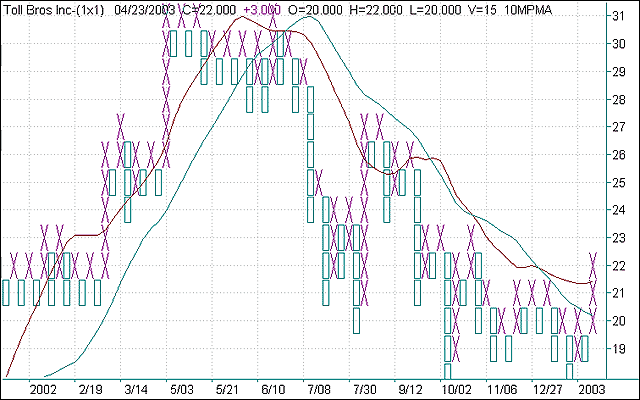
Figure 3 is a chart of Toll Brothers, Inc. (TOL). Here, the downward crossover sell signal occurs at a price of 30, whereas the next sell signal (double-bottom breakout) occurs at a price of 27. In addition, staying with the sell signal would have kept you from buying the triple top at 25, which was followed soon after by a double bottom, also at 25.
Figure 3: Minimizing whipsaws. By trading using the P&F MA signals, you would have avoided additional trades that you would have made if you had just followed the P&F signals.
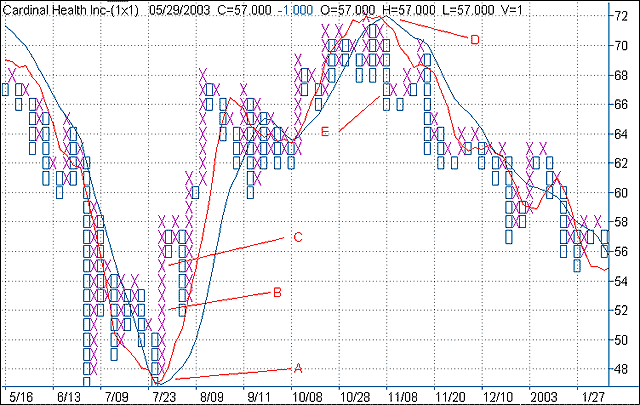
Figure 4 is a chart of Cardinal Health, Inc. (CAH). At A, you see a buy crossover. You could have gotten in at 48 or 49 instead of the double top (B) at 52 or the triple-spread top (C) at 55. If you had bought at one of these buy signals, you might have been tempted to sell at the double bottom, also at 55. (A triple-spread top is similar to a triple top, except that an intervening column does not come up to the same price as the other Xs.) But if you had confidence in the moving average buy signal (based upon the testing you would have done before committing funds to this system), it would have kept you in to at least 68. If you suffered through the whipsaws around 64, the MA would have kept you in up to 72. At D we see a sell signal. I don't think you could have gotten out before the double bottom at E. Again, the moving average downward trend would have kept you from buying the double top at 68, which would have been a short-term move.
Figure 4: Longer-term positions. Here again you see how by following the moving average signals, you could have stayed in the trade longer, absorbing bigger profits.
SUMMARYGranted, these differences are not monumental, but shaving a few points off the buys and adding a few points to the sells seems to warrant trying this procedure. The biggest gains appear to be that the moving averages might keep you in a position where a whipsaw sell signal might have gotten you out prematurely. Only trial and error will show what this method can do for your portfolio. In the meantime, you may want to try different time periods with, possibly, the standard three-box reversal.
Rudy Teseo is a private stock and options trader, and has taught classes in option trading and basics of stock charting. He can be reached at RFTESS@juno.com.
Current and past articles from Working Money, The Investors' Magazine, can be found at Working-Money.com.
|
Rudy Teseo is a private investor who trades stocks, options, and currencies. He has taught classes in technical analysis and option trading. He may be reached at rftess@optonline.net.
| E-mail address: | rftess@optonline.net |
PRINT THIS ARTICLE

Request Information From Our Sponsors
- StockCharts.com, Inc.
- Candle Patterns
- Candlestick Charting Explained
- Intermarket Technical Analysis
- John Murphy on Chart Analysis
- John Murphy's Chart Pattern Recognition
- John Murphy's Market Message
- MurphyExplainsMarketAnalysis-Intermarket Analysis
- MurphyExplainsMarketAnalysis-Visual Analysis
- StockCharts.com
- Technical Analysis of the Financial Markets
- The Visual Investor
- VectorVest, Inc.
- Executive Premier Workshop
- One-Day Options Course
- OptionsPro
- Retirement Income Workshop
- Sure-Fire Trading Systems (VectorVest, Inc.)
- Trading as a Business Workshop
- VectorVest 7 EOD
- VectorVest 7 RealTime/IntraDay
- VectorVest AutoTester
- VectorVest Educational Services
- VectorVest OnLine
- VectorVest Options Analyzer
- VectorVest ProGraphics v6.0
- VectorVest ProTrader 7
- VectorVest RealTime Derby Tool
- VectorVest Simulator
- VectorVest Variator
- VectorVest Watchdog


