HOT TOPICS LIST
- Strategies
- Stocks
- Buy
- Investing
- Brokers
- Psychology
- Interviews
- Accumulate
- Sell
- Hold
- Spotlight
- Websites
- Candlestick Corner
- Gold & Metals
- Options Trading
LIST OF TOPICS
FOCUS ON
Intermarket Relationships
04/15/03 04:04:47 PM PSTby David Penn
From commodities and bonds to stocks and the US dollar, can intermarket relationships tell us where we are headed?
| I have recommended John Murphy's Intermarket Technical Analysis on many occasions as a way for traders and technical analysts to get a larger sense of what is going on, not just in a given market nor even in a set of markets, but in terms of the various relationships between different markets. It is from Murphy's book that we learn (or are reminded) on a technical basis, for example, that bond prices have a tendency to lead stock prices, and that the market tends to have a cycle during which different asset groups outperform other asset groups. Murphy presented this cycle as follows:
Much of Murphy's research — and many of the examples provided in Intermarket Technical Analysis — draw upon the price action of markets in the 1980s. Using this dataset, Murphy has shown compelling evidence for his intermarket cycle, particularly leading up to the crash of 1987 in a section titled "The Bond Collapse — A Warning For Stocks." In addition to this work, Murphy makes the case for the inverse relationship between commodities and bonds, the inverse relationship between the dollar and commodities, the "positive relationship" between stocks and bonds, and a variety of relationships within commodity groups.
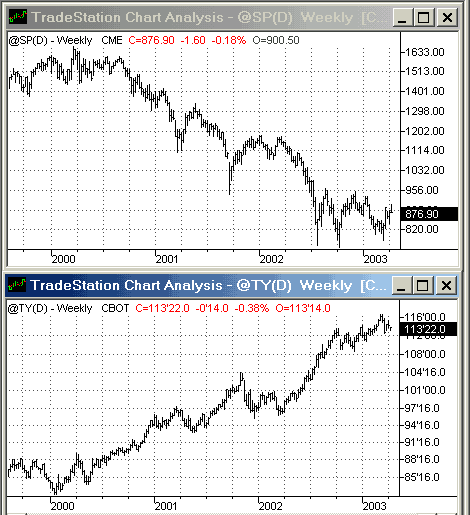
THE DEFLATIONARY DIFFERENCEIn an article for Working Money a little over a year ago, I delved into some of Murphy's explanations on the positive relationship between stocks and bonds. Specifically, in a piece called "Gibson's Paradox," I pointed out that in a deflationary environment characterized by an overvalued currency, the positive relationship between stocks and bonds turns into an inverse relationship. Thus, instead of bond prices leading stock prices up or down, bond prices move in the opposite direction as stock prices and bond yields begin to lead stocks. I compared the performance of Japanese government bonds to the performance of the Nikkei 225 in the 1990s. That comparison revealed that while bond prices rose in a steady, almost unbroken fashion, the prices of Japanese equities fluctuated wildly — albeit in a largely downward fashion — throughout the decade. Unfortunately, the continued rally in the US government bond market provides us with an opportunity to see something similar — though, thus far on a smaller scale (see Figure 1).
Figure 1: The stock market and the government long-bond market have moved in opposite directions for three years running.
Note initially that as the stock market — as represented by the Standard & Poor's 500 — has moved down, the government long bond market — as represented by the 10-year Treasury bond — has moved up. This is as close to a perfect inverse correlation as could be imagined. A common explanation for this phenomenon is that there is a rush to the safety of bonds when stocks appear to be in trouble — which would certainly characterize the performance of stocks since 2001. However, in the case of a deflationary environment, rising bond prices — particularly to the extremes seen in late 2002 and early 2003 — reflect a willingness on the part of investors to receive less and less in the way of "risk-free" returns. In other words, rising bond prices also mean falling bond yields. And the willingness of bond investors to accept increasingly less cash in exchange (albeit guaranteed cash) for their principal is another signal of an increasingly deflationary financial climate in which dollars are perceived to be relatively "scarce." This is all particularly interesting given the sideways price action that has characterized the S&P 500 for the past nine months or so — really ever since the July 2002 lows. Given the three-year tendencies expressed in the charts, if the S&P 500 were to begin a new bull market, then the government long bond market would be expected to finally begin a true bear market period. Even if stocks have yet to show true signs of beginning a new bull market, then there is at least some sign on the bonds side that fixed-income proponents are throwing in the towel. Pimco bond manager Bill Gross, who is widely believed to be among the sharpest knives in the Wall Street drawer, is on record as admitting that the bond market's "salad days" are over. In the context of the bull market that bonds have been enjoying since the early 1980s (in a secular sense), this sort of admission from Bill Gross is almost paradigm-shattering.
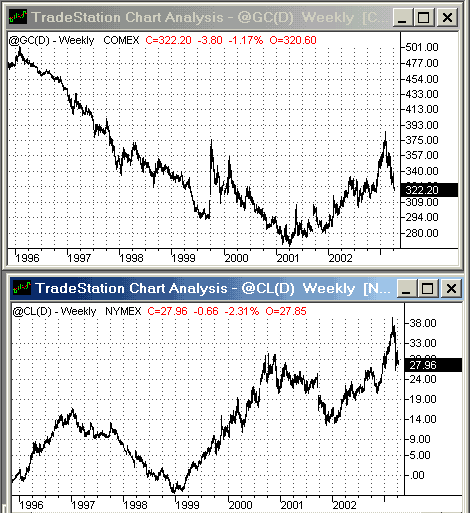
GOLD, OIL, AND THE RESTMost of those watching the financial news are aware of the recent bull markets in gold and in oil. Generally, the advances in both are credited to growing geopolitical concerns, particularly in the Middle East. However, it is worth noting that, for its part, gold bottomed early in 2001 — during a time when geopolitical concerns were nowhere near what they would be by the end of that year. Crude oil was making a peak as 2001 arrived, but this peak was coming off of a bull market that began in 1999 (see Figure 2). Gold appeared to be making a bottom in 1999, two years before the lower low in 2001 (in the opinion of many Wall Street observers including legendary investor Warren Buffett, who allegedly made significant precious metals purchases early in 1999).
Figure 2: Sharing relative bottoms in 1999, both gold and oil advanced throughout 2002 and peaked early in 2003.
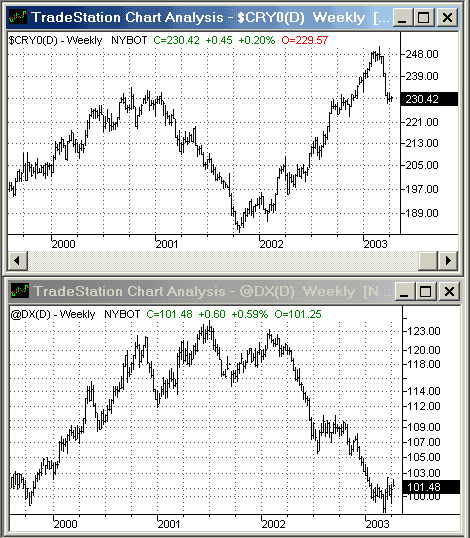
As the CRB index chart in Figure 3 confirms, commodities as a whole appeared to top out in 2003. And this is true even when groups like the grains, which have been in a bear market for over five years (except for soybeans), are taken into account. This tends to lend further credence to the deflation thesis — at least in the short term — as prices for commodities across the board undergo significant selling pressure. More fuel for that fire is provided by the chart of the greenback — represented here by the continuous futures of the dollar contract traded at the New York Board of Trade — which appears to be bottoming after an extended decline.
Figure 3: Commodities and the dollar have moved in opposite directions for over a year now.
It is not necessarily a big discovery that commodities and the US dollar tend to trade inversely. But it is perhaps a different matter altogether to see that inverse correlation in action — and to understand those implications in real life. First, it appears as if commodities prices are in store for corrections and reversals — as has been the case in gold and oil and will likely be seen in other commodities, possibly including natural gas, metals, and even further declines in the grains. Second, the talk of the dollar's imminent plunge into an inflationary abyss seems, at a minimum, premature. In fact, we must wonder what sort of deflationary anxieties will begin to grow if the dollar reverses and moves up into the 105109 range — or even higher.
REFLATION NATION?
Third, and finally, there seems to be a make-or-break moment looming for both bonds and stocks. If the two are still locked in an deflationary, inverse relationship, then any continued weakness in stocks — for whatever reason — would be expected to result in even lower, long bond yields. In this scenario, conversely, a continued rally in stocks extending into second-quarter 2003 would suggest lower bond prices and higher bond yields — again, if the deflationary aspects of the current financial environment dominate. There are a number of ways to gauge deflation, from the PPI (producer price index) or CPI (consumer price index) to gold price targeting to surveying deflationary psychology in the statements of politicians and government officials. In many ways, the abundance of tools to measure deflation — as well as the relative abundance of ways to define deflation — is one of the reasons I look to intermarket relationships; in the final analysis, I am more concerned with whether gold or bonds are rising or falling, for example, than I am in the economic question of whether we are in a deflationary or inflationary (reflationary, to most) economic environment. Often, the price action of the key intermarket asset classes can make the answer to that question if not irrelevant from a trading or investment perspective, then at least one that can be reached from the bottom up. Thus, certain outcomes, while possible, are exceptionally less likely than others in the current context. For example, a rally in stocks is unlikely, as is a continued rally in bond prices, which was the paradigm during much of the 1980s when the economy was growing out of its inflationary past (this process has been referred to by some as "disinflation," as opposed to outright "deflation"). That, of course, is the positive "unlikely" scenario. The negative unlikely scenario is grim indeed, involving both a new bear market in bond prices and a renewed bear market in stocks. The movement in the dollar and in the commodities markets would be the chief indicator here of what sort of malady would have arrived to bring about such a problem for financial assets in general. Were this "negative unlikely" to occur in the backdrop of a renewed bull market in commodities and continued declines in the greenback, then it would be reasonable to suspect that inflationary anxieties were approaching dangerous levels. However, if falling stock and bond markets are accompanied by falling commodities and a rising dollar, then the reflationists will realize that they truly do have their work cut out for them in trying to tame a potentially destructive deflation that may leave little in its wake by the time it is finished.
David Penn may be reached at DPenn@Traders.com.
SUGGESTED READINGLaing, Jonathan R. [2003]. "A truly amazing run," Barron's: March.Murphy, John J. [1991]. Intermarket Technical Analysis, John Wiley & Sons. Penn, David [2002]. "Gibson's Paradox," Working Money: March. Charts courtesy of TradeStation
Current and past articles from Working Money, The Investors' Magazine, can be found at Working-Money.com. |
Technical Writer for Technical Analysis of STOCKS & COMMODITIES magazine, Working-Money.com, and Traders.com Advantage.
| Title: | Traders.com Technical Writer |
| Company: | Technical Analysis, Inc. |
| Address: | 4757 California Avenue SW |
| Seattle, WA 98116 | |
| Phone # for sales: | 206 938 0570 |
| Fax: | 206 938 1307 |
| Website: | www.traders.com |
| E-mail address: | DPenn@traders.com |
Traders' Resource Links | |
| Charting the Stock Market: The Wyckoff Method -- Books | |
| Working-Money.com -- Online Trading Services | |
| Traders.com Advantage -- Online Trading Services | |
| Technical Analysis of Stocks & Commodities -- Publications and Newsletters | |
| Working Money, at Working-Money.com -- Publications and Newsletters | |
| Traders.com Advantage -- Publications and Newsletters | |
| Professional Traders Starter Kit -- Software | |
PRINT THIS ARTICLE

|

Request Information From Our Sponsors
- VectorVest, Inc.
- Executive Premier Workshop
- One-Day Options Course
- OptionsPro
- Retirement Income Workshop
- Sure-Fire Trading Systems (VectorVest, Inc.)
- Trading as a Business Workshop
- VectorVest 7 EOD
- VectorVest 7 RealTime/IntraDay
- VectorVest AutoTester
- VectorVest Educational Services
- VectorVest OnLine
- VectorVest Options Analyzer
- VectorVest ProGraphics v6.0
- VectorVest ProTrader 7
- VectorVest RealTime Derby Tool
- VectorVest Simulator
- VectorVest Variator
- VectorVest Watchdog
- StockCharts.com, Inc.
- Candle Patterns
- Candlestick Charting Explained
- Intermarket Technical Analysis
- John Murphy on Chart Analysis
- John Murphy's Chart Pattern Recognition
- John Murphy's Market Message
- MurphyExplainsMarketAnalysis-Intermarket Analysis
- MurphyExplainsMarketAnalysis-Visual Analysis
- StockCharts.com
- Technical Analysis of the Financial Markets
- The Visual Investor


