HOT TOPICS LIST
- Strategies
- Stocks
- Buy
- Investing
- Brokers
- Psychology
- Interviews
- Accumulate
- Sell
- Hold
- Spotlight
- Websites
- Candlestick Corner
- Gold & Metals
- Options Trading
LIST OF TOPICS
CANDLESTICK CORNER
Trading Candlestick Patterns
04/01/03 04:07:45 PM PSTby Dennis D. Peterson
There's more to candlesticks than a visually appealing display of the open, high, low, and close.
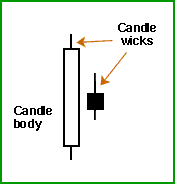
| Many traders prefer to use the candlestick technique in their charting because the method conveys OHLC (open high low close) daily data in a clearer, more visual manner than price bars can. This is because the body of a candlestick is color-coded to indicate whether the close is higher or lower than the open. A candlestick has two major parts: the candle body (Figure 1: rectangle), the top and bottom of which represent the open and close, and the candle wick, also referred to as its hair or shadow (Figure 1: vertical lines extending above and below rectangle), which represents the high and low of the day.
Candlestick analysis is about patterns, often two-day patterns. Technicians have created a lexicon for how a day looks: Up and down days, inside and outside days, and narrow and wide range days. Candlestick analysis involves talking about sequences of the aforementioned days, so there is an overlap in terminology. In addition, the candlestick method allows traders to study candle shadow lengths (the highs and lows), which is difficult when dealing with OHLC bars.
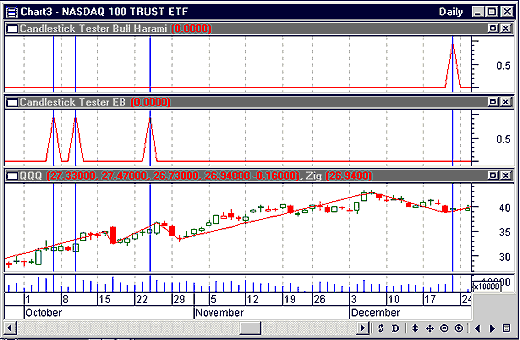
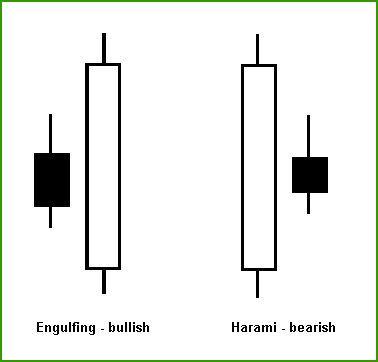
THE PATTERNSCandlesticks are an important element of your analysis arsenal, because you may find it easier to recognize trading patterns by using candlesticks. You may want to use a five-legged process to choose trades. Two of those legs involve using trading patterns in conjunction with indicators. The other three legs involve finding the equity or equities that the market has an interest in; cycle analysis (for example, Gann fans used in conjunction with 16- and 32-day rise/runs or Elliott wave analysis); and trade management. You will find that candlestick patterns are generally setups for continuations or reversals of price swings but not trends — remember, a trend is composed of swings. Trends are too long to be affected by a single candlestick pattern, whereas swings are short enough to reflect the implication of a candlestick pattern. You need to be aware of three issues when learning about candlestick patterns. First, you must distinguish between the most reliable patterns and the most frequently encountered because they are not the same. Second, candlesticks have a short half-life — that is, their influence can diminish dramatically as you go from one day beyond the event to seven days beyond, and therefore are applicable to swings rather than trends. Third and finally, patterns are either continuation or reversal patterns for trends or swings — if you don't know whether you are in a trend, your reliability will suffer. With candlesticks, there are more reversal patterns than continuations, and six patterns dominate the reversal patterns. The six are harami (for an up- or downswing reversal), engulfing (for an up- or downswing reversal), hammer (for a downtrend reversal), and hanging man (for an upswing reversal). But these are not the most reliable patterns. In addition, reliability is also a function of how long it takes before a swing or trend has reversed. Let's look at some examples to put this into perspective (Figures 2 and 3). When I ask the built-in software to identify engulfing bull and harami bull patterns (Figure 2), I get a couple of small surprises. Without dwelling on what these two candlestick patterns look like, let's talk about results (Figure 3).
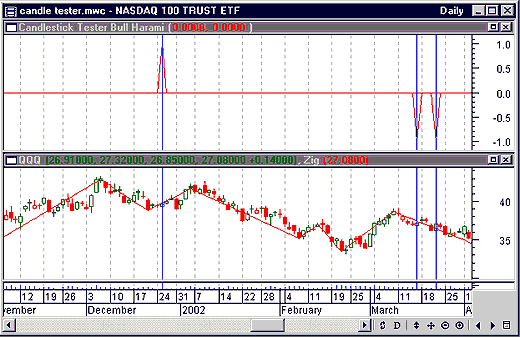
An engulfing pattern is referred to as bullish because the first candle body is dark, indicating it is a down day followed by an up day. The theory is that if you see this pattern in a downswing, you expect a reversal — that is, the start of an upswing or bullish move. So what are the surprises? First, you can see that two engulfing bulls were identified where the first body is short (Figure 2: candle body to the left of the first blue line). Second, simply finding the pattern is not sufficient to correctly infer a result. This is because in both of the first two instances of the engulfing bull, it is clear the tradable is in an upswing and not a downswing, and as a result nothing happens. There is something else you should notice. While candlesticks do not deal directly with range (defined as the difference between high and low), when candle shadows (which reflect highs and lows) are analyzed, they do deal with range. Many indicators deal successfully with range, and this bodes well for candlestick analysis. I will now try to make a profit by refining the way I use candlestick patterns. I will use a bull pattern only if I am in a downswing. I will use a seven-day linear regression slope to determine whether it is a downswing, and I will also require that the first body of the engulfing pattern be no less than 30% of the range of the first body. I will also switch to a bullish engulfing pattern (Figure 3). My first results, as can be seen in Figure 4, were disappointing; engulfing patterns proved to be less than reliable in providing a signal for a swing reversal. In his book CandlePower, Greg Morris has a series of excellent tables of candlestick statistics. One table shows the bullish engulfing pattern, or engulfing +, for three periods with a 55% success rate for a broad class of stocks.
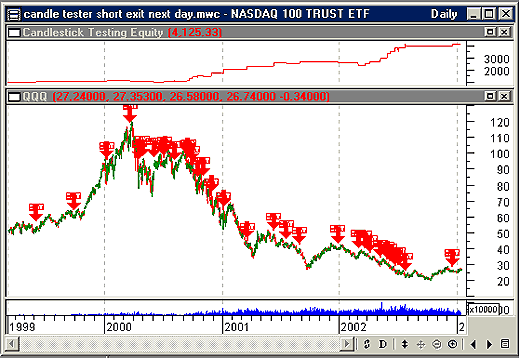
Trying to use the engulfing pattern with QQQ is even worse. I had to allow four days to pass to get a better result rather than getting out in one, two, or three days after the event. From Morris's tables we would infer the opposite; that is, the longer you wait, the worse it gets in terms of predictive reliability (but then we are only talking about 55% versus 49%). Before abandoning the engulfing + pattern, I tried 4,320 combinations of linear regression periods, first and second body ratios, and days to wait before exiting the long position. I concluded that with QQQ you are more likely to lose money. What would happen if I short with the same setup? Once I do, I make one "small" adjustment by having all trades exit as quickly as possible, which ends up being two days for each trade. When I tell MetaStock to use a set of linear regression slope periods and a set of ratios for candle body lengths, the result is a profit for every combination. The best result has an average win to average loss ratio of 2.46 with 23 winning trades and nine losing trades (Figure 5). Find the trading system in sidebar, "The candlestick trading system."
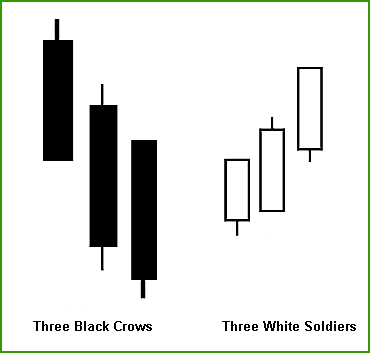
WHAT'S THE MESSAGE?If you hadn't seen the equity curve (Figure 5,top chart), you might have guessed all the action would occur during a bear market. Perhaps more surprising, there were three winning trades in 1999 and 2000 and elsewhere, but serious profit can be made when the market is trending down. This makes sense to me, and although I am reluctant to promote shorting, it is a fact of life and a clear winner (at least in this case). The message: If a short-term price slope is not positive, you have an upday that engulfs the previous day, and you are in a bear market, take a short position for two days. Maybe in the beginning this might have seemed counterintuitive, but taking profits with shorts in a bear market is clearly a winning strategy. The identical three-crows pattern terminating an upswing or the three white-soldiers pattern terminating a downswing (Figure 6) appear to be the most reliable — that is, three downdays or updays in a row to signal a reversal.
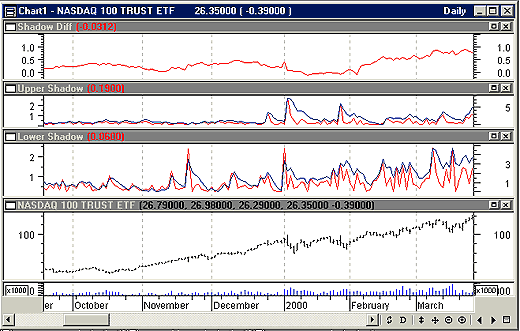
So, what good are candlesticks if the most frequently appearing pattern is only a little better than chance of having a reversal and the most reliable pattern appears infrequently? If you are geared up to search for the three candlestick patterns daily for all stocks, then obviously the pattern should make a profit for you — not a living, perhaps, but a profit. The last aspect of candlestick analysis I want to explore is shadow length. Shadows, you may recall, reflect the range — that is, the day's high-low. Some useful indicators have been created using range, and therefore shadow length presumably holds promise. If you chart the upper and lower shadow lengths, what you see during a strong bullish uptrend is lower shadows (Figure 7: third chart from top) in general are longer than upper shadows (Figure 7: second chart from top).
Figure 7: Daily QQQ price and volume and candlestick shadow lengths. The top chart is a 22-day simple moving average (SMA) of lower shadow lengths minus a 22-day SMA of upper shadow lengths. The second chart from top is raw upper shadow lengths (red) with a five-day SMA of shadow length (blue), while the third chart from the top is raw lower shadow lengths (red) with a five-day SMA of shadow length (blue). What you see is that in a strong bull market, lower shadow lengths are generally longer than upper shadow lengths.
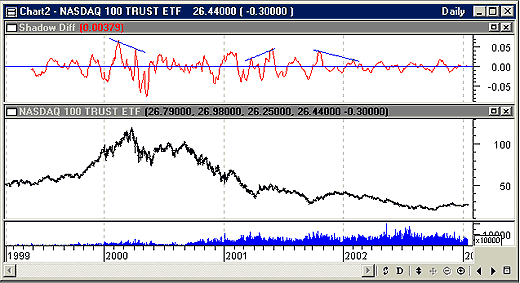
Take a look at the result. During a strong bull market, when the market sells off it generally rebounds well, while conversely when it is buying, the profit-taking during the day is small. Can we use this trend in buying and selling to detect shifts in sentiment? Yes, perhaps, but it will be difficult. I wanted to see the momentum of upper shadow-lower shadow, so I created the moving average convergence/divergence (MACD) of the daily difference. But the daily difference is noisy, so I used 22-day moving averages of each and used that difference to create the MACD. The result, which can be seen in Figure 8, is what appears to be an oscillator. I have drawn some lines across pairs of oscillator peaks to identify some instances of divergence. My limited research into shadow lengths makes me believe that using them as pattern indicators could be risky. However, using them as a momentum indicator appears to have some validity. For those who want to go further, try putting in a filter that only retains what you might call a wide-range day.
SUMMARYIf you want to trade two-day patterns, there are probably easier ways, such as those investigated by Toby Crabel. Nevertheless, there are some useful strategies using candlestick patterns that, given enough tries, should turn a profit if you have a reasonable measure of whether the market is bullish or bearish. My suggestion? Test your ideas beforehand because of the reliability issues, and make sure that your intuition about how the market behaves is, in fact, the way the market behaves. Dennis D. Peterson may be reached at DPeterson@Traders.com.
RELATED READING AND REFERENCESCrabel, Toby [198890]. Technical Analysis of Stocks & Commodities, Volumes 6-8.Morris, Gregory L. [1992]. CandlePower, Probus Publishing. Nison, Steve [2001]. Japanese Candlestick Charting Techniques, 2d ed., New York Institute of Finance. Peterson, Dennis D. [2002]. "What Is A Pivot?" Working Money, February 19. MetaStock (Equis International)
SIDEBAR THE CANDLESTICK TRADING SYSTEM Short Entry body1:=Abs(C-O); body2:=Abs(Ref(C,-1)-Ref(O,-1)); cond1:=If(LinRegSlope(C,opt1)<opt2,1,0); cond2:=body1>body2; cond3:=body2>opt3*(Ref(H,-1)-Ref(L,-1)); cond4:=C-O>0 AND Ref(C,-1)-Ref(O,-1)<0; buy:=cond1 AND cond2 AND cond3 AND cond4; buy
Short Exit body1:=Abs(C-O); body2:=Abs(Ref(C,-1)-Ref(O,-1)); cond1:=If(LinRegSlope(C,opt1)<opt2,1,0); cond2:=body1>body2; cond3:=body2>opt3*(Ref(H,-1)-Ref(L,-1)); cond4:=C-O>0 AND Ref(C,-1)-Ref(O,-1)<0; exit:=cond1 AND cond2 AND cond3 AND cond4; exit:=If(Ref(exit,-opt4),1,0);exit
Optimization Opt1 4 to 24 in steps of 4, Opt2 0.5 to 0 in steps of 0.1, and Opt3 0.2 to 0.7 in steps of 0.1. Opt 4 is set to 2. Delay entry one day, exit on the same day, and margin is 50%.
MACD of Shadow Length Differences uppershadow:= If(C>O,H-C,If(C<O,H-O,0)); Lowershadow:=If(C>O,O-L,If(C<O,C-L,0)); shadowdiff:=Mov(lowershadow,22,S)-Mov(uppershadow,22,S); diff:=Mov(shadowdiff,12,E)-Mov(shadowdiff,26,E); signal:=Mov(diff,9,E);diff-signal
— DDP
Current and past articles from Working Money, The Investors' Magazine, can be found at Working-Money.com.
|
Market index trading on a daily basis.
| Title: | Staff Writer |
| Company: | Technical Analysis, Inc. |
| Address: | 4757 California Ave SW |
| Seattle, WA 98116-4499 | |
| Phone # for sales: | 206 938 0570 |
| Fax: | 206 938 1307 |
| Website: | working-money.com |
| E-mail address: | dpeterson@traders.com |
Traders' Resource Links | |
| Charting the Stock Market: The Wyckoff Method -- Books | |
| Working-Money.com -- Online Trading Services | |
| Traders.com Advantage -- Online Trading Services | |
| Technical Analysis of Stocks & Commodities -- Publications and Newsletters | |
| Working Money, at Working-Money.com -- Publications and Newsletters | |
| Traders.com Advantage -- Publications and Newsletters | |
| Professional Traders Starter Kit -- Software | |
PRINT THIS ARTICLE

|

Request Information From Our Sponsors
- VectorVest, Inc.
- Executive Premier Workshop
- One-Day Options Course
- OptionsPro
- Retirement Income Workshop
- Sure-Fire Trading Systems (VectorVest, Inc.)
- Trading as a Business Workshop
- VectorVest 7 EOD
- VectorVest 7 RealTime/IntraDay
- VectorVest AutoTester
- VectorVest Educational Services
- VectorVest OnLine
- VectorVest Options Analyzer
- VectorVest ProGraphics v6.0
- VectorVest ProTrader 7
- VectorVest RealTime Derby Tool
- VectorVest Simulator
- VectorVest Variator
- VectorVest Watchdog
- StockCharts.com, Inc.
- Candle Patterns
- Candlestick Charting Explained
- Intermarket Technical Analysis
- John Murphy on Chart Analysis
- John Murphy's Chart Pattern Recognition
- John Murphy's Market Message
- MurphyExplainsMarketAnalysis-Intermarket Analysis
- MurphyExplainsMarketAnalysis-Visual Analysis
- StockCharts.com
- Technical Analysis of the Financial Markets
- The Visual Investor

