HOT TOPICS LIST
- Strategies
- Stocks
- Buy
- Investing
- Brokers
- Psychology
- Interviews
- Accumulate
- Sell
- Hold
- Spotlight
- Websites
- Candlestick Corner
- Gold & Metals
- Options Trading
LIST OF TOPICS
Using Relative Strength
02/25/03 03:57:23 PM PSTby Steve Watkins
Here's how to use relative strength as a buy or sell indicator.
| Do you find yourself buying stocks that look like they're breaking out of a solid base, only to find that the breakout fails? Or do you hold onto stocks that appear to be strong long-term performers, only to see them break down so fast you wind up taking a loss? Let me tell you something you may find useful. To help you avoid those pitfalls, take a look at the stock's relative strength line. Easy to overlook but hard to ignore, the relative strength line (not to be confused with the relative strength index, something altogether different) is simply a measure of a stock's performance against a key market average, usually the Standard & Poor's 500. Rather than merely looking in a vacuum at how a stock is performing, relative strength stacks it up against the overall market. A stock may appear to be doing well, but if it's in a time period where the market is doing even better, that stock probably isn't as great as you thought. On the flip side, if a stock looks weak but the market is even weaker, the stock could be poised for a major breakout once the market turns. Everything's relative.
USING RELATIVE STRENGTHRelative strength is based on a simple premise: If the line is heading up, the stock is outperforming the S&P 500. If the line is turning down, the stock is underperforming the index. The steepness of the relative strength line tells you how much better or worse than the market the stock is doing. Using that information in your trades is another story. Pay particularly close attention to the relative strength line's direction just as a stock is breaking out from a solid base. (Those are the stocks that investors using William O'Neil's CANSLIM method seek out.) These stocks are breaking out to new highs on heavy volume after building a base that is at least seven weeks long. This usually means that the charts have formed basing patterns such as a cup-with-handle, saucer, or double bottom. When they are breaking into new highs on heavy volume, investors are ready to pounce. Before jumping on that stock, though, take a moment to see which direction the relative strength line is heading and where it lies relative to its past. An upward-sloping relative strength line just before a stock breaks out of a solid base gives a strong confirmation to the stock's breakout. It means the stock has outperformed the market, even as it was building a base. Depending on the shape of the base and the point in time at which the relative strength line made a move up, the stock might have climbed faster than the market for a few weeks before flattening out to form the handle in the base. Or the stock could have stayed flat for a few weeks as volume dried up, even as the overall market was slumping. This would cause the relative strength line to head up while the stock remained flat, just before it broke out of the base. In either case, once the stock generates a powerful breakout, the relative strength line is likely to head even higher. Make sure that it does keep climbing, because that means the stock is doing more than just riding along with a rising market. A climbing relative strength line confirms the breakout and sends a strong signal that it's a good time to buy the stock.
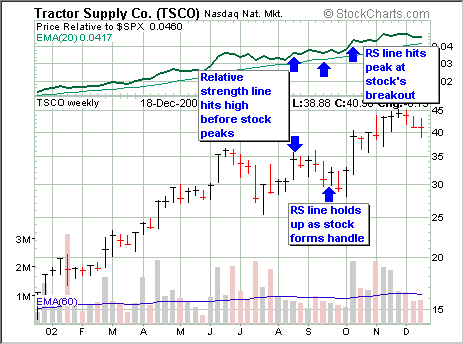
HERE'S AN EXAMPLEIdeally, the stock's relative strength line will hit a high just as the stock is breaking out. That puts the cap on an already climbing relative strength line and gives you a pretty strong signal that your stock is a good buy. Let's consider some examples. Farm equipment maker Tractor Supply Co. (TSCO) (Figure 1) carved out a new base beginning in June and running through October. But at the same time the stock price was falling more than 30% from the top of its base to the bottom, its relative strength line was holding up. That's because the stock fell while the market was falling just as fast.
Figure 1: Example of a strong stock. Even though the stock price was declining, the relative strength line was holding up. This suggests that the stock was starting a new base during a time when the market was falling.
If you look at this stock in a vacuum, it would seem to have fallen on hard times. In reality, it was simply starting a new base just as the market was tanking. After the base bottomed out, the stock and its relative strength line both turned up. When the stock formed a handle over seven weeks and its volume dried up, the relative strength line kept climbing. Finally, in October, TSCO broke out on heavy volume to a new high. The relative strength line, already in new high ground, shot even higher. The stock broke out on positive earnings news. The relative strength line confirmed the other elements of the chart's base. TSCO shot up 20% after the breakout. Keep in mind that the other key elements of a stock breaking out of a solid base must also be present. For example, if a strong base is forming such as the cup-with-handle formation, it should be over a period of at least seven weeks, showing declining volume in the handle and seeing a surging breakout on heavy volume of at least 50% above average. This may mean you are buying a stock at a new high, something that is against everything you've heard the so-called experts say. You'll often hear market pundits comment that stocks "are on sale," or "They're a good buy at this (low) price," or "This stock is too expensive to buy right now." But buying when stocks are at a high means the stock is performing well. It follows the theory that you get what you pay for. Stocks trading at $2 or $3 per share usually trade there for a reason. Perhaps their earnings are down, the company's or industry's fundamentals are bad, or other problems have reared their ugly heads at the company. Likewise, stocks trading at new highs trade there for a reason. Maybe the company has come out with a new product (part of the "N" in the CANSLIM theory), its industry is on an upswing, or earnings have been going gangbusters. Beyond that, buying a stock at a new high means you will not run into the problem of overhead supply. That means you're avoiding the issue of past buyers of the stock deciding to sell because they've waited it out while the stock dropped and now are just glad to break even. Likewise, when a relative strength line hits a new high, it means the stock is doing better versus the overall market than it has ever done. This might make you feel like you're walking a tightrope without a net, but take heart in the facts surrounding the stock. It's reaching new highs for a reason. What's more, history shows that stocks exhibiting strong characteristics and breaking out to new highs are among the best all-time performers.
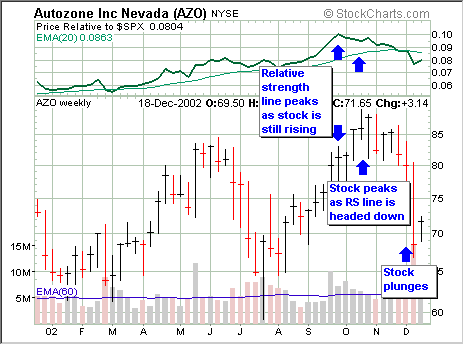
SELLING A STOCKWhen a stock is climbing but still failing to keep up with the market, the relative strength line will reflect that. You'll see a rising stock with a falling relative strength line. That could be a sign that it's time to sell the stock. During times when the market rises for eight consecutive weeks, most stocks will rise. But how do you determine which ones in your portfolio to let ride and which ones to dump? Take a look at the chart of Autozone (AZO) in Figure 2. The stock gained 51% in 13 weeks, peaking at $89.34 the week of October 21. But its relative strength line peaked in late September and was slumping by the time the stock peaked. Sure enough, once the market headed south in late November, AZO went with it and fell even faster. It lost 24% over a seven-week span and closed below $70 the week of December 9.
Figure 2: Weaker than the market. As prices were moving higher in October, the relative strength line was declining. This means it's likely the stock price will decline.
STRENGTH OR WEAKNESSSimply examining the relative strength line isn't the answer to making buy or sell recommendations. You should also look at key fundamental and technical details such as the overall direction of the market. However, relative strength can help you avoid buying stocks that are weak and selling those that are strong. So before entering or exiting your trade, don't forget to take a close look at the relative strength line.
Steve Watkins is a freelance writer and former staff writer for Investor's Business Daily. He previously was managing editor of the Cincinnati Business Courier. He can be reached via e-mail at swcubswin@earthlink.net.
SUGGESTED READINGCanslim.netO'Neil, William J. [2002]. How To Make Money In Stocks: A Winning System In Good Times And Bad, 3rd edition, McGraw-Hill. Penn, David [2001]. "He Knows Investors' Business, Daily: William J. O'Neil," interview, Working Money: July.
Charts courtesy of StockCharts.com
Current and past articles from Working Money, The Investors' Magazine, can be found at Working-Money.com.
|
| E-mail address: | swcubswin@earthlink.net |
PRINT THIS ARTICLE

|

Request Information From Our Sponsors
- StockCharts.com, Inc.
- Candle Patterns
- Candlestick Charting Explained
- Intermarket Technical Analysis
- John Murphy on Chart Analysis
- John Murphy's Chart Pattern Recognition
- John Murphy's Market Message
- MurphyExplainsMarketAnalysis-Intermarket Analysis
- MurphyExplainsMarketAnalysis-Visual Analysis
- StockCharts.com
- Technical Analysis of the Financial Markets
- The Visual Investor
- VectorVest, Inc.
- Executive Premier Workshop
- One-Day Options Course
- OptionsPro
- Retirement Income Workshop
- Sure-Fire Trading Systems (VectorVest, Inc.)
- Trading as a Business Workshop
- VectorVest 7 EOD
- VectorVest 7 RealTime/IntraDay
- VectorVest AutoTester
- VectorVest Educational Services
- VectorVest OnLine
- VectorVest Options Analyzer
- VectorVest ProGraphics v6.0
- VectorVest ProTrader 7
- VectorVest RealTime Derby Tool
- VectorVest Simulator
- VectorVest Variator
- VectorVest Watchdog


