HOT TOPICS LIST
- Strategies
- Stocks
- Buy
- Investing
- Brokers
- Psychology
- Interviews
- Accumulate
- Sell
- Hold
- Spotlight
- Websites
- Candlestick Corner
- Gold & Metals
- Options Trading
LIST OF TOPICS
CANDLESTICK CORNER
How Reliable Are Candlesticks?
08/27/02 03:06:16 PM PSTby Giovanni Maiani
If you're a hard-numbers kind of trader, statistically oriented, you've probably always been suspicious of the candlestick technique. "How reliable are they?" you've probably asked. Here's your answer.
| In order to quantify the reliability of Japanese candlestick formations, I decided to conduct some statistical research. I found the most reliable of the simple candlestick patterns — those made up of a single candlestick — to be the dragonfly doji, hammer, inverted hammer, and rising window formations. I analyzed 575 American stocks/bonds over a period of 1520 years, from the early 1980s to the present. Using MetaStock's definition for candlestick patterns, those being international standards, I identified each candlestick formation and observed the trend starting from the day after the formation occurred. I looked for about 40 patterns and tabulated each trend's subsequent rise, decline, or neutral movement. My goal was to get statistical percentages on the most reliable candlestick formations.
RESULTSIn my studies, I found more than 6.14 million candlestick formations. This number may be unusually high because some of the simple formations such as the inverted hammer (or black marubozu) were counted twice if they became part of a larger, multiple-candlestick formation. Counting both simple and compound candlestick formations offers a complete, detailed, and effective analysis. Figure 1 displays the 10 most frequent and the 10 least common candlestick formations. The second column shows the percentage of the total found, and the last column shows the percentage that preceded a rise, fall, or sideways movement on the following day. Clearly, the white body is the most common candlestick, with more than two million occurrences. This represents 32.6% (nearly one-third) of the total. Second and third most common are the hammer and black body, with 12.6% and 12.1% of the total, respectively. These three figures represent more than half the candlestick formations. Note that while the white body appears almost one-third of the time, big white candles appear only 2% of the time.
Figure 1: Most frequent and least common candlestick formations. At the bottom of the chart are the star formations: morning doji, evening doji, evening star, and morning star. These are quite rare, as are the three white soldiers and three black crow formations. The last row in Figure 1 shows how many up, down, or neutral days followed a candlestick formation. In 44.02% of the cases, a white body anticipated a rising session; in 43.85% of the cases a decline occurred; and 12.12% of the time the price did not change. The number of up days is almost the same as down days. I attribute this to the large number of occurrences, which tends to smooth out the results. Nevertheless, my results for the most reliable candlestick patterns are displayed in Figure 2.
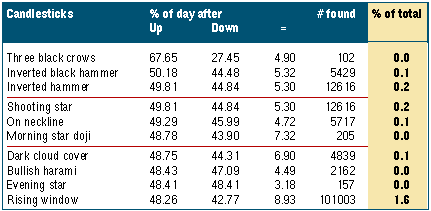
Figure 2: Occurrences of the most reliable candlestick patterns.
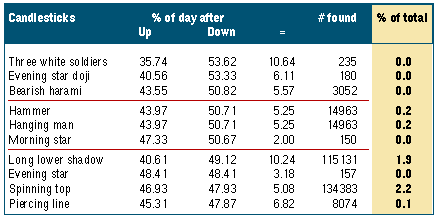
Figure 2 does not take into consideration the total number of occurrences, or any percentage of the total, but only the percentage of rising versus falling sessions. This makes the candlesticks easier to compare with each other. From this standpoint, three black crows anticipates an up day 67.65% of the time, a down day 25.45%, and unchanged prices 4.90% of the time. But going back to the frequency of occurrences, how much can you benefit from a candlestick pattern that, although correct 68% of the time, has only occurred 102 times in 6.14 million sessions? You would get an accurate buy signal 0.001% of the time, or 69 times in 20 years of trading! My study shows that generally, the rarer the pattern, the more likely it is to be accurate. Let's see if this phenomenon also occurs in candlesticks anticipating declining sessions. In the same way, in Figure 3 you see the 10 most accurate candlestick patterns to anticipate a declining session. In this case we find three white soldiers, the complement to three black crows, in first place. This pattern preceded an up day 53.62% of the time, a down day 35.74% of the time, and for 10.64% the price remained unchanged. Also note that candlesticks predicting bearish reversals occur less frequently than those with bullish implications. Again, the larger the database, or the more frequent the occurrences, the more likely the pattern is to be statistically accurate. (In extreme cases, such as if a pattern only occurs once, it appears as either 100% accurate or inaccurate.)
Figure 3: Candlestick patterns that are most accurate in anticipating a declining session.
Figure 4 shows the top 10 candlesticks to anticipate an unchanged session. At the top is the gravestone doji, which is accurate 23.53% of the time. This particular pattern doesn't appear to be any more reliable in predicting up or down days either. The same applies to tweezer bottom and tweezer top formations, which in one-fifth of the cases anticipate an unchanged session. These candlesticks do occur quite frequently, however — 4.2% and 4.0% of the time, respectively.
Figure 4: Candlestick patterns that are most accurate in anticipating an unchanged session. Figure 5 shows the 14 most frequently occurring candlestick patterns. These represent 95.5% of the total found, but in only a few cases can they be used to anticipate the following day's session. Of these, the long lower shadow seems to be the most reliable. It is present 1.9% of the time, and anticipates a declining session 49.12% of the time and a rising session 40.61% of the time. Second-most reliable is the inverted hammer, with 46.91% of the following sessions rising, versus 41.2% declines. Fourth is the hammer, which is present 12.6% of the time; it precedes a decline 45.71% of the time, while a rising session occurs following 40.9% of hammers.
Figure 5: Most frequently occurring candlestick patterns.
INTERNATIONAL COMPARISONI have repeated my analysis for the international shares market and in all cases have found that the three most frequent candlestick formations are the white body, hammer, and black body. The results of these tests can be seen in Figure 6. I compared nine markets and found the three most frequently occurring candlestick patterns, their percentage of occurrence, and the rise, fall, or neutral movement of the stock on the following day.
Figure 6: Most frequent candlestick patterns across international markets.
I found that the three most frequently occurring patterns represented from 46.7% to 57.4% of all candlestick pattern occurrences for each market. These results are roughly the same as those found in the US market.
CONCLUSIONThe distribution of candlestick patterns, at least for the three most commonly occurring, has been consistent over time and through different markets. These three patterns are the white body, hammer, and black body.
Giovanni Maiani is an analyst for an Italian weekly financial publication called Borsa&Finanza. He may be reached at maiani@financialresearch.sm and www.financialresearch.sm.
SUGGESTED READINGYamanaka, Sharon [2000]. "Stocks And The Art Of Charts," Working Money, November 22.
www.financialresearch.sm
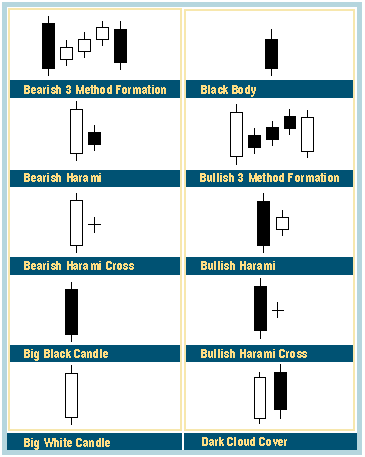
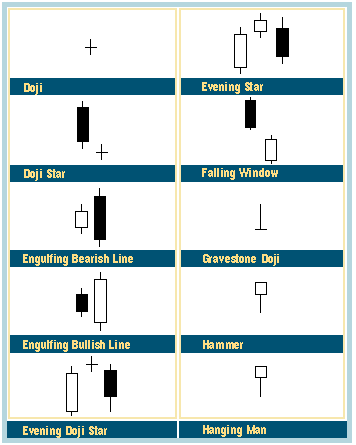
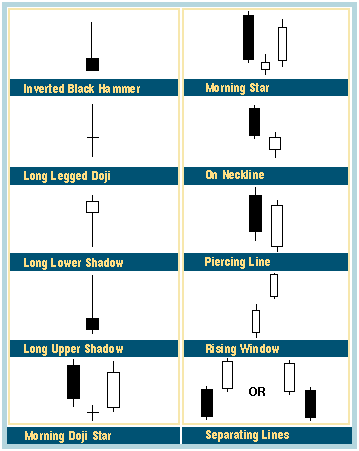
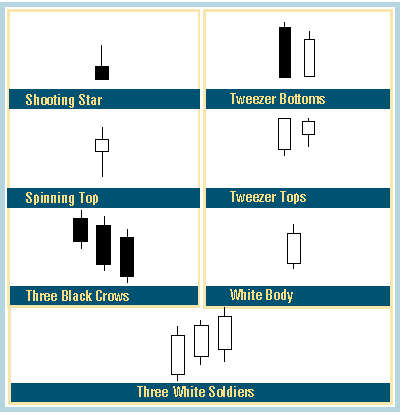
SIDEBAR: PATTERNSBelow is a guide to some of the candlestick patterns discussed in this article.
Current and past articles from Working Money, The Investors' Magazine, can be found at Working-Money.com. |
| E-mail address: | maiani@financialresearch.sm |
PRINT THIS ARTICLE

|

Request Information From Our Sponsors
- VectorVest, Inc.
- Executive Premier Workshop
- One-Day Options Course
- OptionsPro
- Retirement Income Workshop
- Sure-Fire Trading Systems (VectorVest, Inc.)
- Trading as a Business Workshop
- VectorVest 7 EOD
- VectorVest 7 RealTime/IntraDay
- VectorVest AutoTester
- VectorVest Educational Services
- VectorVest OnLine
- VectorVest Options Analyzer
- VectorVest ProGraphics v6.0
- VectorVest ProTrader 7
- VectorVest RealTime Derby Tool
- VectorVest Simulator
- VectorVest Variator
- VectorVest Watchdog
- StockCharts.com, Inc.
- Candle Patterns
- Candlestick Charting Explained
- Intermarket Technical Analysis
- John Murphy on Chart Analysis
- John Murphy's Chart Pattern Recognition
- John Murphy's Market Message
- MurphyExplainsMarketAnalysis-Intermarket Analysis
- MurphyExplainsMarketAnalysis-Visual Analysis
- StockCharts.com
- Technical Analysis of the Financial Markets
- The Visual Investor


