HOT TOPICS LIST
- Strategies
- Stocks
- Buy
- Investing
- Brokers
- Psychology
- Interviews
- Accumulate
- Sell
- Hold
- Spotlight
- Websites
- Candlestick Corner
- Gold & Metals
- Options Trading
LIST OF TOPICS
MARKET UPDATE
Utilities: Used And Abused
02/26/02 03:20:44 PM PSTby David Penn
With growth companies going nowhere and recession holding the broader economy back, utility stocks with their predictable revenues and big dividends should be the place to be. So why aren't they?
| An investment commercial from Charles Schwab & Co. features a man visiting his elderly mother. The theme of the commercial is that it would be wonderful if you felt the same way about your broker as you feel about some of the most trusted people in your life. One moment in the commercial has the mother providing a little kindly, down-home advice to her grown-up son, advice that ends with: "Think about small caps and midcaps, some laddered munis, and be sure to stay diversified by taking advantage of current opportunities in the Asian markets." "No utilities?" he asks. No utilities, indeed. Although many financial commentators seem to be heralding the end of the economic downturn already, those with stocks in the market over the past few years have felt real pain. This has been particularly true in the technology sector, where an entire generation of investors has yet to be fully weaned from the high-growth stocks of only a couple of years ago. Part of this peeling away from high-growth stocks — at least during a time of economic recession and an underperforming stock market — should eventually benefit other stocks, particularly in defensive sectors such as foods, health care, and utilities. Unfortunately, while other defensive sectors are gaining — or at least holding their own — utilities essentially have gone nowhere in the past two years. Health care, which enjoyed a raging bull market in the year 2000 but far less spectacular gains in 2001, has been a worthwhile place for investor capital since the bear market in equities began in autumn 2000. The same can be said for food stocks that, as measured by the Standard & Poor's Food Index, have more or less held their own, trading in the upper registers of a long-term range that stretches back to the peak of December 2000. However, the utilities group has been under severe pressure in 2001. After a spectacular 2000, in which the Dow Jones Utilities Average appreciated 54%, the DJUA was hammered in 2001, losing virtually all of the gains of the previous year. If 2000 was the year that Enron Corp. soared and Californians went hat in hand for energy in the midst of summer blackouts, then 2001 was the year that Enron crashed and burned and Californians realized that they had committed themselves to paying above the market rate for energy going forward.
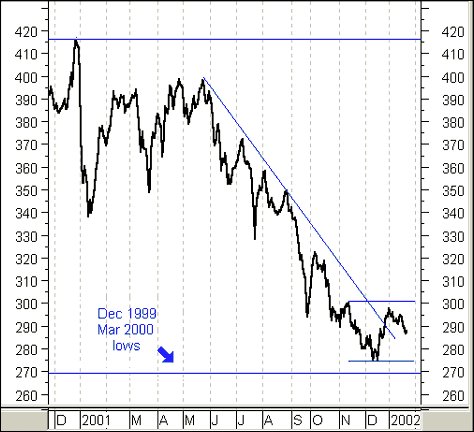
PERFORMANCE AND UNDERPERFORMANCEBut does this explain the woeful underperformance of the utilities group in 2001, an underperformance so severe that the prior year's gains have been completely consumed? The cascade of falling interest rates during 2001 should have buoyed utility stocks in much the same way that bonds were supported and able to advance. The relatively higher yields in utility stocks should also have been a big plus for investors looking at money market interest rates between 2% and 3%. What is worrisome, from the point of view of investing in utilities, is the prospect of rising interest rates — which many see as inevitable, given the current Fed funds rate. Rising interest rates would dramatically increase borrowing costs for the typically debt-fueled utilities sector, to say nothing of removing the dividend advantage that utility stocks have over some fixed-income instruments. From an intermarket perspective, the longer-term rise in the DJUA corresponds with the bull market in bonds. Both the DJUA and the 10-year Treasury note bottomed in December 1999 and successfully retested those bottoms in March and April 2000, respectively. These bottom tests, incidentally, coincide with the peaks in the S&P 500 and Nasdaq. As the equities markets continued to deteriorate in 2000, both bonds and utility stocks benefited, even in the face of a shift in the Federal Reserve Board's monetary policy that resulted in a 100-basis-point increase in 2000 from 5.5% to 6.5% by December. The DJUA's bull market gave way dramatically at the end of 2000 just as the DJUA looked poised technically (with an ascending triangle) to reach higher highs. In hindsight, it appears that it was the rate increases of 2000 that killed the bull market in utilities. The DJUA made two lower peaks in the spring of 2000, but from that moment, the bear was in control of utility stocks. From a May 2001 peak of 400, the DJUA reached a 2001 low of 280 in December, a loss of 30% (Figure 1). Even as utility stocks participated in the "war rally" of September, these stocks abruptly stalled near resistance, then resumed their descent. Most recently, utility stocks staged a minor rally in December 2001, though that rally petered out in January 2002, with a test of the December 2001 lows likely in the weeks to come.
Figure 1: The bear market in utilities heads toward tests of both long-term and short-term bottoms.
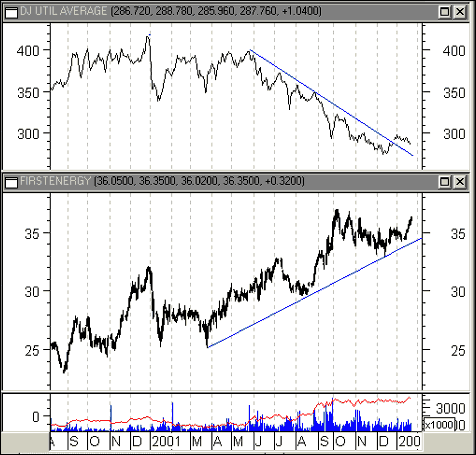
THE UTILITIES INSIDE THE UTILITIESOf the 15 stocks of the DJUA, fully a third did not follow the DJUA's descent in 2001, either by continuing on with the gains of 2000 or by holding steady in a trading range. These stocks are Con Ed (ED), Edison International (EIX), First Energy (FE), Pacific Gas & Electric (PCG), and TXU Corp. (TXU). All represent electric utilities interests, and each took a big hit at the beginning of 2001, along with the rest of the DJUA stocks. However, some of these stocks — namely PCG and EIX — rallied strongly from the lows to finish 2001 with impressive returns. Although these two stocks have yet to return to their 2000 numbers, both were up more than 100% in 2001. Other DJUA stocks like FE, TXU, and ED took less of a licking and kept on ticking. Each of these three stocks found support at the end of the December 2001 selloff on upward trendlines that had their origins in the March 2000 bottom. Using the January 2001 low that occurred mid-month (instead of January 1, 2001), FE managed to rack up a 44% year in 2001 (see Figure 2), while both ED and TXU Corp. finished with 31%. These returns are not as breathtaking as those of PCG and EIX, but it bears remembering that part of these latter two stocks' spectacular gains comes as a snapback rally after both stocks were hammered exiting 2000.
Figure 2: First Energy (FE) advanced in spite of the bear market, which restrained most utility stocks.
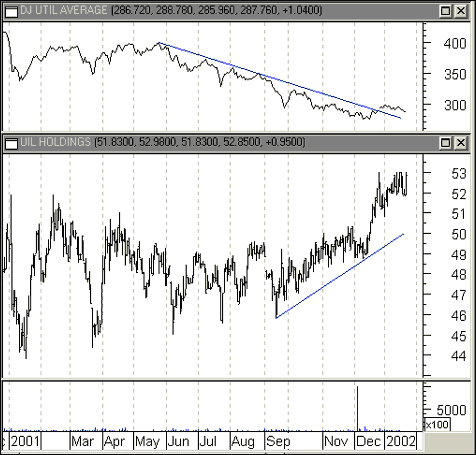
This focus on DJUA utility stocks is mostly to provide a general sense of where the utilities sector is and what utilities investors might expect out of the biggest utility companies. There are a number of relatively smaller utilities companies, such as Cinergy (CIN), Pinnacle West (PNW), UIL Holdings (UIL), and Wisconsin Energy (WEC), that have strong charts (see Figure 3) and positive fundamentals, though many of these companies are thinly traded compared to the companies in the DJUA. Nevertheless, between growth and the ever-present possibility of consolidation, some of these smaller utilities companies may be good places to be when they are discovered by more of the investing public.
Figure 3: Some of the non-Dow utility stocks rallied strongly in the second half of 2001.
TOWARD A BOTTOM IN UTILITIESLooking at the chart of the DJUA, it appears that an important test of the December 2000/March 2001 bottom is in the making. In this sense, having taken back most of the gains of 2000, the DJUA may be ready to advance once again. The bear market in utilities that began in April 2001 looks to be running into strong support at 275, the point at which the December 2001 rally begins. Unfortunately, with the December rally petering out in January 2002, it looks as if utilities might make a retest of the late 2001 bottom at 275 (which would represent a second test of the long-term, December 2000/March 2001 bottom). For the chart readers, the current price action in the DJUA may resemble a head-and-shoulders bottom. Such a pattern would be constructed using the decline and advance from October to mid-November 2001 to make the left shoulder and the decline and advance from November 2001 to January 2002 to make the head. The right shoulder seems to start with the January 2002 rally peak and trough just after mid-month. A successful breakout would come from an upmove above the current neckline of 301. Overall, while utility stocks have not fared particularly well — even in a bear market in which defensive stocks are usually more sought after by investors — it appears that individual utility companies have managed to hold their ground or even advance. What remains to be seen is how these already strong utility stocks will perform, should the DJUA successfully rally from lows not seen since the winter of 2000 and the spring of 2001.
David Penn may be reached at DPenn@Traders.com. MetaStock (Equis International)
Current and past articles from Working Money, The Investors' Magazine, can be found at Working-Money.com. |
Technical Writer for Technical Analysis of STOCKS & COMMODITIES magazine, Working-Money.com, and Traders.com Advantage.
| Title: | Traders.com Technical Writer |
| Company: | Technical Analysis, Inc. |
| Address: | 4757 California Avenue SW |
| Seattle, WA 98116 | |
| Phone # for sales: | 206 938 0570 |
| Fax: | 206 938 1307 |
| Website: | www.traders.com |
| E-mail address: | DPenn@traders.com |
Traders' Resource Links | |
| Charting the Stock Market: The Wyckoff Method -- Books | |
| Working-Money.com -- Online Trading Services | |
| Traders.com Advantage -- Online Trading Services | |
| Technical Analysis of Stocks & Commodities -- Publications and Newsletters | |
| Working Money, at Working-Money.com -- Publications and Newsletters | |
| Traders.com Advantage -- Publications and Newsletters | |
| Professional Traders Starter Kit -- Software | |
PRINT THIS ARTICLE

|

Request Information From Our Sponsors
- StockCharts.com, Inc.
- Candle Patterns
- Candlestick Charting Explained
- Intermarket Technical Analysis
- John Murphy on Chart Analysis
- John Murphy's Chart Pattern Recognition
- John Murphy's Market Message
- MurphyExplainsMarketAnalysis-Intermarket Analysis
- MurphyExplainsMarketAnalysis-Visual Analysis
- StockCharts.com
- Technical Analysis of the Financial Markets
- The Visual Investor
- VectorVest, Inc.
- Executive Premier Workshop
- One-Day Options Course
- OptionsPro
- Retirement Income Workshop
- Sure-Fire Trading Systems (VectorVest, Inc.)
- Trading as a Business Workshop
- VectorVest 7 EOD
- VectorVest 7 RealTime/IntraDay
- VectorVest AutoTester
- VectorVest Educational Services
- VectorVest OnLine
- VectorVest Options Analyzer
- VectorVest ProGraphics v6.0
- VectorVest ProTrader 7
- VectorVest RealTime Derby Tool
- VectorVest Simulator
- VectorVest Variator
- VectorVest Watchdog


