HOT TOPICS LIST
- Strategies
- Stocks
- Buy
- Investing
- Brokers
- Psychology
- Interviews
- Accumulate
- Sell
- Hold
- Spotlight
- Websites
- Candlestick Corner
- Gold & Metals
- Options Trading
LIST OF TOPICS
CANDLESTICK CORNER
Candlestick Profits
02/26/02 02:31:01 PM PSTby Stephen W. Bigalow
A charting technique from long ago can help you make a tidy profit.
| Although candlestick charting has been a part of the US trading community for decades, only recently has interest picked up in this technique for investment purposes. The investor who takes the amount of time and effort needed to master candlesticks can reap handsome profits. Candlestick analysis can produce remarkably accurate results, and using it may help you maximize profits while reducing risk exposure. A candlestick signal formation is the result of a change in investor sentiment, not the anticipation of a possible change. This sentiment change may also be a change in trend direction, but buying at the bottom and selling at the top is more difficult than it might seem. Where do you grab the falling knife? When is high too high? Candlestick signals can help alleviate this problem. Candlestick buy signals appearing after an extensive decline in a stock can reveal compelling information that will help you make good trading decisions.
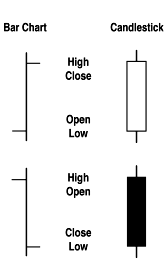
SIMPLE, YET EFFECTIVECandlestick charting originated hundreds of years ago with Japanese rice traders, who used simple techniques to identify high-probability profitable trades. Candlestick charts put more weight on the opening and closing prices, as well as the high and low of a time period, than do other types of charts. As illustrated in Figure 1, an open that is lower than the close creates a white candle. An open that is higher than the close creates a black candle. It is the positioning of these candles, along with the analysis of their colors, that gives valuable information.
Figure 1: Bars vs. candlesticks. The body of the candlestick helps identify the sentiment behind a price move.
The candlestick technique analyzes two powerful investment considerations: emotion and common sense. Emotion, of course, is the downfall of most investors and traders. Professional investors exploit fear and greed to reap the biggest contributions to their profits, but trading and investing with candlesticks eliminates emotional investing for the most part. Because the candlestick signal is the visual depiction of investor sentiment and illustrates a change that is occurring, the candlestick user can tell when investors in general are creating a profitable opportunity. Most investors panic at bottoms and become overenthusiastic at tops. Being aware of this and seeing it happen in candlestick form helps you to buy when the buy signal is formed at the bottom and sell when you see the sell signal at the top. But what could be considered a highly sophisticated program is merely the accumulation of common-sense observations. This makes candlestick analysis easy to learn, providing insights that can revolutionize your decision-making processes.
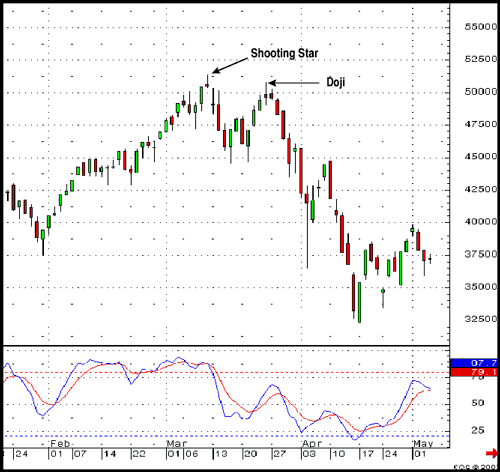
THE POWER OF THE CANDLESTICKThe rise and fall of the bull market in technology stocks remains vivid in the minds of investors. During that bull run, enthusiasm was so great that most investors didn't realize when the market hit its top. But indexes graphically depicted by candlesticks could have shown them when to take profits and/or short stock. Figure 2 shows that a shooting star formed at the top of the Nasdaq. (A shooting star is a candlestick formation where the open and close are at or near each other at the lower third of the daily trading range.) An investor using the candlestick charting technique, upon witnessing a shooting star at the top of a major move, would have been immediately alerted that a top was imminent.
Figure 2: Nasdaq Composite. Candlestick signals were present at the top of the Nasdaq bull market.
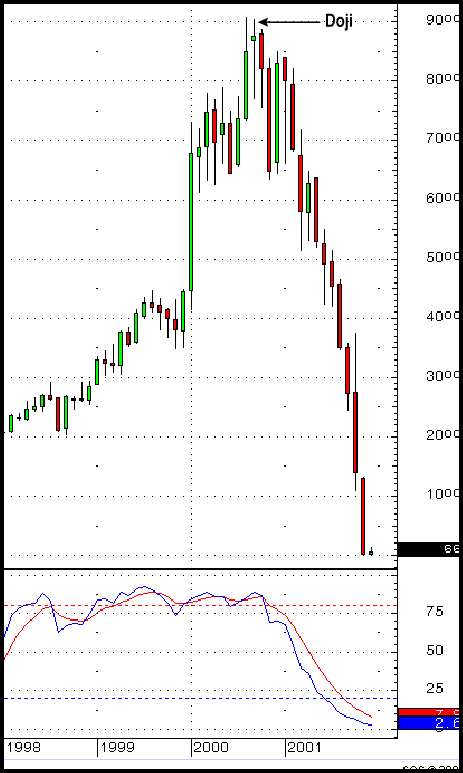
Several weeks afterward, the Nasdaq tried to make a run for another new high. Another candlestick signal, a doji* (a session where the open and close are the same), occurred prior to the move, demonstrating that market buyers were running out of steam. This would have been an opportune time to liquidate all positions. By using candlestick signals, whether you're daytrading, swing trading, or long-term investing, you can identify when the buyers are making a presence and when the sellers are stepping in. Even the fundamental investor can effectively use candlestick signals to protect his or her positions. Revisiting the fundamentals of a company might be warranted at that point. In a good example of hindsight, as can be seen in Figure 3, Enron Corp. (ENE) shareholders could have greatly modified their positions upon viewing the candlestick chart.
Figure 3: Enron Corp. (ENE). The long-term chart shows signs of a pullback. The magnitude could not be anticipated, but employee retirement plans could have been modified.
If you rely on signals, you may find candlesticks to be a useful charting technique by adding simple confirming signals such as stochastics and volume indicators to enhance your analysis even further. There are approximately 40 basic candlestick signals, but a knowledge of eight to 10 is sufficient to help you succeed in your investing. Some of the major signals are the hammer, engulfing patterns, dojis, the dark cloud, the piercing line, the kicker, and the hanging man. Candlestick charting provides the format for developing profitable programs; the degree of profitability will vary with the amount of time you can devote to it. By using candlesticks, your ability to recognize a pattern that points to a change in the direction of a trend increases, giving you the opportunity to amass sizable profits. It's not difficult to master candlestick signals. Knowing how the signals are formed in relation to the general market allows you to take advantage of high-profit situations. Consider taking some time to master this technique. The concepts incorporated by candlestick signals are those that traders are currently using to accumulate huge profits for major brokerage firms; you can do it too.
Stephen W. Bigalow is the principal of the www.candlestickforum.com, a leading website for providing information and educational material about candlestick investing. He can be reached at sbigalow@msn.com.
RELATED READINGBigalow, Stephen [2002]. Profitable Candlestick Investing: Pinpointing Market Opportunities To Maximize Profits, John Wiley & Sons.
CQG, Inc.
Current and past articles from Working Money, The Investors' Magazine, can be found at Working-Money.com. * See our online glossary |
Stephen W. Bigalow is an author and the principal of the www.candlestickforum.com, a website for providing information and educational material about candlestick investing.
| Website: | www.candlestickforum.com |
| E-mail address: | sbigalow@msn.com |
PRINT THIS ARTICLE

|

Request Information From Our Sponsors
- StockCharts.com, Inc.
- Candle Patterns
- Candlestick Charting Explained
- Intermarket Technical Analysis
- John Murphy on Chart Analysis
- John Murphy's Chart Pattern Recognition
- John Murphy's Market Message
- MurphyExplainsMarketAnalysis-Intermarket Analysis
- MurphyExplainsMarketAnalysis-Visual Analysis
- StockCharts.com
- Technical Analysis of the Financial Markets
- The Visual Investor
- VectorVest, Inc.
- Executive Premier Workshop
- One-Day Options Course
- OptionsPro
- Retirement Income Workshop
- Sure-Fire Trading Systems (VectorVest, Inc.)
- Trading as a Business Workshop
- VectorVest 7 EOD
- VectorVest 7 RealTime/IntraDay
- VectorVest AutoTester
- VectorVest Educational Services
- VectorVest OnLine
- VectorVest Options Analyzer
- VectorVest ProGraphics v6.0
- VectorVest ProTrader 7
- VectorVest RealTime Derby Tool
- VectorVest Simulator
- VectorVest Variator
- VectorVest Watchdog


