HOT TOPICS LIST
- Strategies
- Stocks
- Buy
- Investing
- Brokers
- Psychology
- Interviews
- Accumulate
- Sell
- Hold
- Spotlight
- Websites
- Candlestick Corner
- Gold & Metals
- Options Trading
LIST OF TOPICS
DOW THEORY
The Hot War Bear
11/27/01 01:47:02 PM PSTby David Penn
The Crash of 1929 and the Great Depression initiated the first secular bear market of the 20th century. Do those events hold any lessons for investors in the 21st?
| In a previous article, I introduced the concept of the secular bear market, roughly between 1962 and 1982, as "The Cold War Bear." So it simplifies matters to refer to the secular bear market between 1929 and 1946 as "The Hot War Bear," insofar as its duration encompasses World War II. But for investors in the 21st century, who may stand on the verge of the third secular bear market in 100 years, what might matter most is that unlike the Cold War Bear of 196282, the Hot War Bear was a deflationary secular bear market. Deflation causes prices for a range of assets and goods to plummet in a downward spiral that keeps both wages and corporate earnings down. A belief in endlessly falling prices (the opposite of inflationary economies, in which prices seem to always be rising) encourages consumers to save rather than spend (why buy today what you can buy cheaper tomorrow?), and companies find themselves forced to constantly lower prices in the face of weakening demand. There is a growing suspicion that it is deflation, not inflation, that is the more long-term threat to our economy at present. Thus, some consideration of what a secular bear market looks like in a deflationary economy (like the Hot War bear market from 1929 to 1946) may hold some clues as to what to expect in the future, should the markets remain in bear territory for an extended time, and deflation once again rise up as a challenge to productive capital.
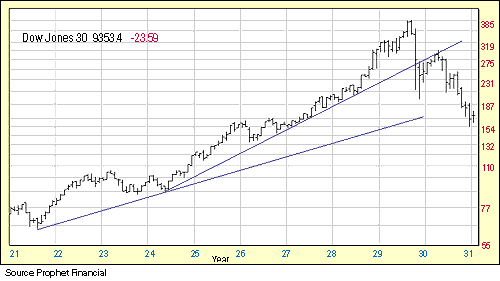
BIG BUBBLESOne of the most obvious comparisons between the 192946 secular bear market and the one we appear to have entered in the spring of 2000 is the nature of the advance that preceded it. Not since the stock market bubble of the late 1920s has the stock market been as rife with wild margin speculation, arrogant amateurs, and a sense of boundless opportunity as it was in 1999. Too many investors are more familiar with the devastation of the Crash of 1929 than they are with the period that led up to it — knowledge that, in 1998 and 1999, could have saved investors millions of dollars. The Crash of 1929 was not without warning. The Dow Jones Industrial Average (DJIA) went into overdrive in 1926 after five years of steady gains. At the end of 1926, the DJIA was at 154, having begun the decade at approximately 75, an increase of 105% (Figure 1). This, incidentally, compares with a 100% increase in the DJIA from 1991 to 1996 (2500 to 5000). In the three years from the end of 1926 to late 1929, the DJIA tacked on another 150%, rising to a peak of 385 (compared with 130% for the DJIA between 1996 and 1999).
Figure 1: The Dow Jones industrials gained 105% from 1921 to 1926. But from 1926 to the end of 1929, the DJIA advanced 150%. Such excessive market runups are common when bull markets give way to bear markets. Market observers have argued that the more excessive the market runup, the more devastating the correction when the inevitable selling occurs. In part, this has less to do with good companies becoming bad ones and more to do with the level of speculation and the number of bad companies able to take advantage of inexperienced investors (who are virtually hypnotized by the performance of the broad market). Stock dividend yields, for example, tend to disappear during market runups. This is in part because many of the new companies entering the market during the last stage of a bull market are not successful enough to pay dividends. In addition, the widespread belief in eternal capital appreciation makes investors less interested in demanding dividends in return for the risk of stocks. After all, when a market advances more than 100% in less than five years, who needs dividend yields to get rich?
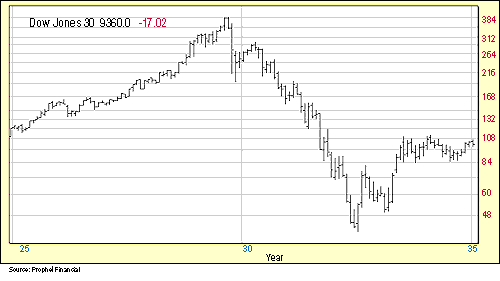
TO THE BOTTOM AND BACK AGAINIf there is any solace to be had from the story of the Crash of 1929, it lies in the fact that the worst was over relatively quickly. In contrast to the 196282 secular bear market — in which the declines of 1966 and 1969 were mere preludes to the collapse of 197374 — the bottom of the 192946 secular bear market was reached in the summer of 1932. This is not to deemphasize the pain of the Crash; those invested at the top saw the DJIA fall from 384 to 42 in approximately three years, a loss of 89% (see Figure 2). But such a crash is quite different from the grinding, churning, going-nowhere secular bear market of 196282.
Figure 2: The Crash of 1929 wasted no time in reaching its ultimate bottom, shedding 89% in three years.
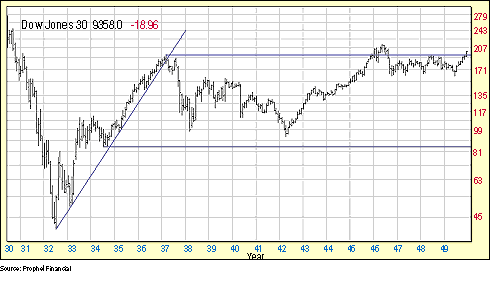
As relentless as the market collapse was from August 1929 until July 1932, the rally from that historic crash was almost as impressive. When DJIA prices successfully retested the 1932 lows in the spring of 1933 (the initial rally attempt failed in the fall of 1932), they rallied 70% from 50 to 85 by summer, entering a consolidation range between 108 and 85 that lasted until the spring of 1935. In 1935, the DJIA continued its rally, climbing 75% from 108 to 185 by 1937 (Figure 3).
Figure 3: After the rally of the early 1930s, the DJIA remained in a range between 189 and 90 for almost 12 years.
Unfortunately, Dow 185 would prove to be stiff resistance for stocks for several years. First reached in 1937, this level would not be breached again until 1946, at the peak of the stock market's "war rally" from the spring low of 1942. Even then, a postwar recession from 1947 to 1949 limited a real breakout from this secular bear market until the 1950s were under way. The support level put in place by the 1934 lows kept prices from revisiting the depths of 1932. Major declines in 193738 and 194042 lost 48% and 38%, respectively. But the support at Dow 84 held.
DEFLATION AND BEAR MARKETSWriting in the HSBC Economics and Investment Strategy newsletter in 1998, Roger Bootle noted, "The long run historical experience is not one of continual inflation but rather of periods of inflation and deflation alternating, with the result that over long spans of time there was no continual upward drift of the price level." In the United States, the period from 1920 through 1940 was the most recent time this was the case. US inflation remained in negative territory for the entire period, not moving into positive territory for good until the mid-1950s. This is in contrast to the relatively high inflation that characterized the period from the mid-1960s to the early 1980s. There is nothing inherent in the relationship between bear markets and inflationary or deflationary economies. As has been suggested, both types of bear markets can be and have been present in US history. If anything, deflation and secular bear markets tend to produce similar challenges to capital: declining prices, declining asset values, declining wages, and declining profits. This means, among other things, exceptional difficulty for stock price appreciation, which suggests that bonds may be the stars of the investment sky for the next several years. On the other hand, as the chart of the 192946 secular bear market suggests — and more specifically, the rally in the early 1930s — there may be opportunities for stocks even in a deflationary bear market. In Deflation, economist A. Gary Shilling says that at the conclusion of an analysis of dividend yield and P/E ratios, "The total nominal return to stocks during a steady state of deflation will be in the 5% to 6% area, and in real terms, 1% to 2% higher." Shilling is quick to point out that this may not seem like much to investors accustomed to 20% or 30% annual returns from stocks, even if it does more accurately reflect historical norms. But the "limited alternative investments" in a deflationary economy, combined with more stocks offering attractive dividend yields, are likely to make stocks a worthwhile investment for patient investors, even in a secular bear market.
David Penn may be reached at DPenn@Traders.com.
SUGGESTED READINGBootle, Roger [1998]. "The Threat Of Deflation," HSBC Economics And Investment Strategy newsletter.Penn, David [2001]. "The Cold War Bear," Working Money, Volume 2: December. Shilling, A. Gary [1998]. Deflation: How To Survive And Thrive In The Coming Wave Of Deflation, McGraw-Hill.
Current and past articles from Working Money, The Investors' Magazine, can be found at Working-Money.com.
|
Technical Writer for Technical Analysis of STOCKS & COMMODITIES magazine, Working-Money.com, and Traders.com Advantage.
| Title: | Traders.com Technical Writer |
| Company: | Technical Analysis, Inc. |
| Address: | 4757 California Avenue SW |
| Seattle, WA 98116 | |
| Phone # for sales: | 206 938 0570 |
| Fax: | 206 938 1307 |
| Website: | www.traders.com |
| E-mail address: | DPenn@traders.com |
Traders' Resource Links | |
| Charting the Stock Market: The Wyckoff Method -- Books | |
| Working-Money.com -- Online Trading Services | |
| Traders.com Advantage -- Online Trading Services | |
| Technical Analysis of Stocks & Commodities -- Publications and Newsletters | |
| Working Money, at Working-Money.com -- Publications and Newsletters | |
| Traders.com Advantage -- Publications and Newsletters | |
| Professional Traders Starter Kit -- Software | |
PRINT THIS ARTICLE

|

Request Information From Our Sponsors
- StockCharts.com, Inc.
- Candle Patterns
- Candlestick Charting Explained
- Intermarket Technical Analysis
- John Murphy on Chart Analysis
- John Murphy's Chart Pattern Recognition
- John Murphy's Market Message
- MurphyExplainsMarketAnalysis-Intermarket Analysis
- MurphyExplainsMarketAnalysis-Visual Analysis
- StockCharts.com
- Technical Analysis of the Financial Markets
- The Visual Investor
- VectorVest, Inc.
- Executive Premier Workshop
- One-Day Options Course
- OptionsPro
- Retirement Income Workshop
- Sure-Fire Trading Systems (VectorVest, Inc.)
- Trading as a Business Workshop
- VectorVest 7 EOD
- VectorVest 7 RealTime/IntraDay
- VectorVest AutoTester
- VectorVest Educational Services
- VectorVest OnLine
- VectorVest Options Analyzer
- VectorVest ProGraphics v6.0
- VectorVest ProTrader 7
- VectorVest RealTime Derby Tool
- VectorVest Simulator
- VectorVest Variator
- VectorVest Watchdog


