HOT TOPICS LIST
- Strategies
- Stocks
- Buy
- Investing
- Brokers
- Psychology
- Interviews
- Accumulate
- Sell
- Hold
- Spotlight
- Websites
- Candlestick Corner
- Gold & Metals
- Options Trading
LIST OF TOPICS
Candlesticks Vs. Bar Charts
12/04/01 10:11:29 AM PSTby Rudy Teseo
When you look at your charts, do you understand everything they're telling you?
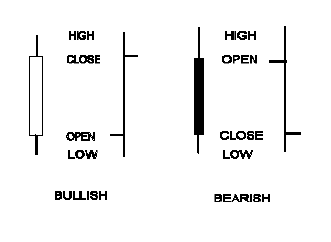
| Most books and articles on candlestick charting point out that any patterns occurring in bar charts (cup with handle, head and shoulder, triangle, and so forth) are also identifiable in candlestick charts. The reverse is also true: Any pattern that can be identified in candlestick charts can be seen in bar charts (Figure 1). However, traditional technical analysis references do not illustrate nor explain candlestick patterns, although they go into great detail on bar pattern analysis.
Figure 1: Candlesticks vs. bars.
Mind you, I'm not trying to talk you into switching entirely to candlesticks. But I would like to suggest that a limited study of selected candlesticks and their corresponding bar charts will make you aware of patterns that you've seen but not attached any importance to. A rose is a rose is a rose, and a bullish harami is a bullish harami, whether you're looking at a candlestick chart or a bar chart. But since standard bar chartoriented texts do not illustrate or explain these patterns, it's unlikely you would recognize them. As a bar chart user, you are familiar with key reversals, inside and outside days, isolated highs and lows, and many other common patterns touted in general technical analysis books and magazine articles. But there are other, equally important patterns you should consider adding to your repertoire. (I'm speaking here of patterns made up of two, three, or four individual bars — not flags, pennants, triangles, and the like.)
ACTION IN A GRAPHIC FORMA candlestick is merely a different form of graphic representation of the day's stock price action. Candlesticks and bars both portray the open-high-low-close (OHLC) of the stock's price, as can be seen in the table below. One of the most significant reversal candlestick patterns is the doji. It looks the same in both systems because it is merely a cross, meaning the open and close of the day were the same. This is an indication of indecision and, therefore, a forewarning of a possible reversal of the current trend. You've probably seen it many times without realizing its significance, since it isn't usually covered in traditional textbooks on technical analysis. Figure 2 shows the corresponding bar patterns of several candlesticks. The brief analysis explains what each pattern is trying to tell us. There are approximately 65 recognized candlestick patterns, roughly 75% reversal patterns and 25% continuation patterns. I've only shown the most popular here, those that are always included in magazine articles or book appendices (as a rule merely introductions to the candlestick method). Print out a copy of Figure 2 and refer to it as you analyze your charts. See if these new patterns tell you a different story than you would have come up with if you had ignored them. If you find this exercise worthwhile, see the suggested readings for complete coverage of all the candlestick patterns.
Figure 2: TABLE OF BAR/CANDLESTICK CONVERSION.
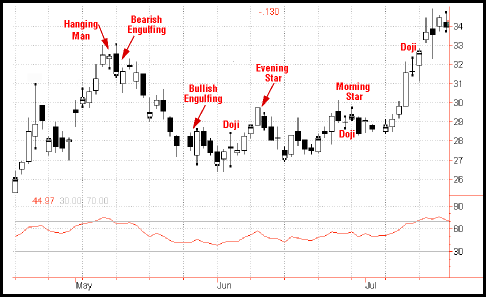
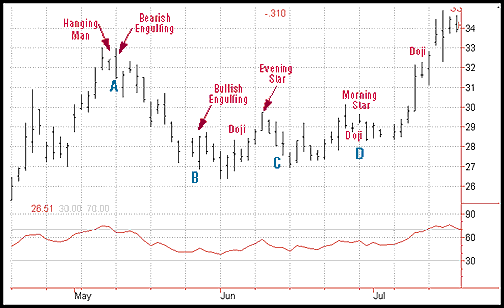
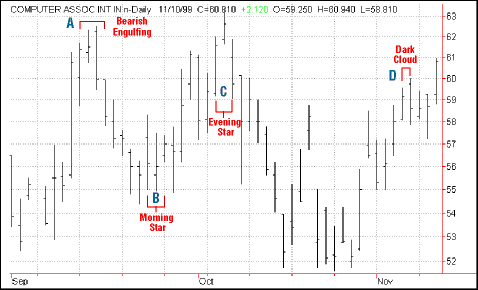
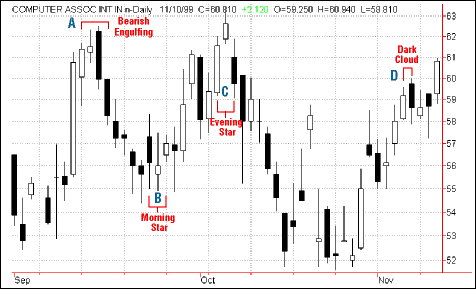
To illustrate that candlestick patterns exist even if you're looking at bar patterns, Figure 3 displays a candlestick chart with the patterns identified. Figure 4 is the same chart, but with bars replacing the candlesticks. At Figure 3 point A, a bearish engulfing pattern emerges immediately after a hanging man, which is another bearish reversal. A minor downturn follows. At point B, a bullish engulfing pattern signals a possible upturn, which then occurs. Shortly into the upturn we find an evening star at point C, which is followed by a downturn. The next pattern, at point D, is a morning star where the star is a doji and, as expected, another upturn is soon under way.
Figure 3: Candlesticks with patterns labeled.
Figure 4: Bar chart version. Can you see the similarities?
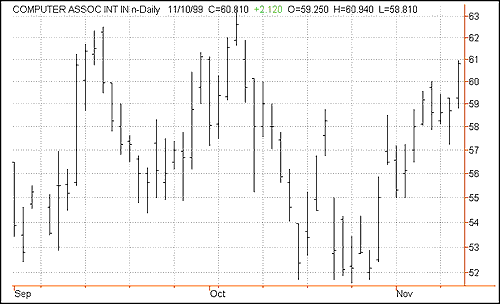
After studying Figures 2 and 4, see if you can identify any of these candlestick patterns in Figure 5.
Figure 5: Try it.
Of course, the patterns will not look exactly like those in Figure 2 because of the different ranges of the bars in Figure 4. However, the relationship of the open and close ticks will be the same, and that is what defines patterns. Perhaps the up and down movement of the price bars will give you a clue as to the type of pattern you would expect to find. To test yourself, place a sheet of opaque paper over the graph and then slowly move it to the right, exposing the bars one by one to simulate daily updating. Try to forecast what's about to happen. Would you buy? Would you sell? When you're finished, refer to Figures 6 and 7 to see how you did.
Figure 6: How did you do?
Figure 7: Did you find candlestick charts easier to use than bar charts?
There is one danger if you follow these suggestions: you may become a candlestick convert.
Rudy Teseo is a retired communications and computer consultant. He has also taught courses in investing, technical analysis, and options trading. You can contact him via e-mail at rftess@juno.com.
SUGGESTED READINGMorris, Gregory L. [1995]. Candlestick Charting Explained: Timeless Techniques For Trading Stocks And Futures, McGraw-Hill.Nison, Steve [1991]. Japanese Candlestick Charting Techniques, New York Institute of Finance/Simon & Schuster. Current and past articles from Working Money, The Investors' Magazine, can be found at Working-Money.com. |
Rudy Teseo is a private investor who trades stocks, options, and currencies. He has taught classes in technical analysis and option trading. He may be reached at rftess@optonline.net.
| E-mail address: | rftess@optonline.net |
PRINT THIS ARTICLE

|

Request Information From Our Sponsors
- StockCharts.com, Inc.
- Candle Patterns
- Candlestick Charting Explained
- Intermarket Technical Analysis
- John Murphy on Chart Analysis
- John Murphy's Chart Pattern Recognition
- John Murphy's Market Message
- MurphyExplainsMarketAnalysis-Intermarket Analysis
- MurphyExplainsMarketAnalysis-Visual Analysis
- StockCharts.com
- Technical Analysis of the Financial Markets
- The Visual Investor
- VectorVest, Inc.
- Executive Premier Workshop
- One-Day Options Course
- OptionsPro
- Retirement Income Workshop
- Sure-Fire Trading Systems (VectorVest, Inc.)
- Trading as a Business Workshop
- VectorVest 7 EOD
- VectorVest 7 RealTime/IntraDay
- VectorVest AutoTester
- VectorVest Educational Services
- VectorVest OnLine
- VectorVest Options Analyzer
- VectorVest ProGraphics v6.0
- VectorVest ProTrader 7
- VectorVest RealTime Derby Tool
- VectorVest Simulator
- VectorVest Variator
- VectorVest Watchdog

