HOT TOPICS LIST
- Strategies
- Stocks
- Buy
- Investing
- Brokers
- Psychology
- Interviews
- Accumulate
- Sell
- Hold
- Spotlight
- Websites
- Candlestick Corner
- Gold & Metals
- Options Trading
LIST OF TOPICS
TECHNICAL ANALYSIS
Candlestick Corner - The Engulfing Pattern
10/11/01 03:56:15 PM PSTby Sharon Yamanaka
This major reversal pattern is simple to use. You don't even need additional indicators. Find out how.
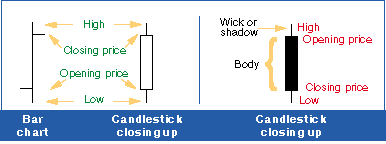
Candlestick formations originated in 18th-century Japan, where the market action was explained in much the same way that we describe stock market sentiment today: as an ongoing battle between bulls and bears fighting for control. Compared to the bar chart, candlesticks use the same information (high, low, opening, and closing prices), but the opening and closing prices are emphasized by converting them into rectangular bodies, or candlesticks, that are closed (dark) when the close is lower than the open, and open (white) when the close is higher (Figure 1). These bodies emphasize the bullishness or bearishness of the market. One glance will give the investor an overall impression of darkness or light that can highlight a stock's rise or fall, even when the overall trend isn't particularly apparent. And therein lies the strength of this charting technique.
Figure 1: Identifying the parts of a candlestick vs. a bar chart.
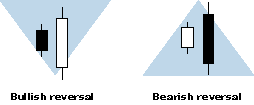
DEFINITIONThe engulfing pattern is considered a major reversal pattern. Unlike other candlestick patterns — such as those I've written about in previous issues of Working-Money.com, in which I used technical indicators as the primary signal and the candlestick formations as the secondary, entry signal — I've found the engulfing pattern can work very well alone, needing only a trailing stop in order to trade effectively. The engulfing pattern consists of two candlesticks. The second body must begin and end above and below the first body, respectively, giving it the illusion of "engulfing" the first candlestick, and the two bodies must be different colors (Figure 2). The shadows or "wicks" are irrelevant in this pattern. As a second condition, in order to get a reversal signal, the security must be in a trend, either going steadily up or down.
Figure 2: The engulfing pattern. For a bottom reversal, where a stock is slowly losing value (in a downtrend), the first candlestick body will be black, and the second, engulfing candlestick will be white. For a top reversal, the opposite would occur with the first candlestick being white and the second black. This is explained in terms of market sentiment as the opposing bullish (bearish) forces taking control of the bears (bulls), ending the day on a strong, positive (negative) note.
ADDITIONAL VERIFICATIONAlthough the engulfing pattern is considered a major signal, there are ways to confirm it:
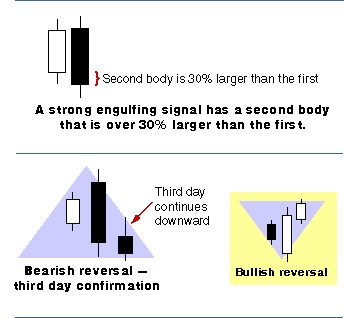
1. The signal is particularly strong if the second candlestick body is 30% larger than the first.
2. The third day confirms the reversal movement of the two-day formation. If it's a top reversal, the third day should close down, and if it's a bottom reversal, the third day should close up.
3. Other technical indicators such as volume, moving averages, and oscillators can be used to confirm trend reversals.
Examples of these are displayed in Figure 3.
Figure 3: Confirmation signals.
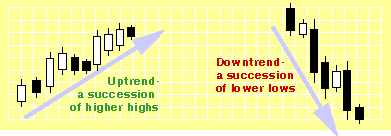
IDENTIFYING A TREND REVERSALThe engulfing pattern itself is easy to identify: either it's there or it's not. What's more subjective is whether it's occurring in a trend. How can you tell if a stock is trending? Basic technical analysis says that any given stock is going up, down, reversing, or going sideways in a consolidation pattern. While this might be the equivalent of telling an art student that everything is made up of either straight lines or curves, it does give parameters that can be used as a beginning point for analysis. A more analytical definition of an uptrend is a succession of higher highs, often calculated using a stock's closing prices. A downtrend is the opposite, with the stock closing to a succession of lower lows. Reversing patterns are those where upward or downward momentum slows down and a peak is formed. Visually, this can be seen in Figure 4, which shows the Sakata method of identifying trading patterns.
Figure 4: Trends. The Sakata method is attributed to Sokyu Honma, who lived in 18th-century Japan and is credited with originating candlestick patterns. Honma became known for his ability to predict the upcoming day's rice trading prices based on the activity of the previous day or days. His method included a complete trading philosophy, part of which defined three types of reversal patterns: a rounded top (bottom), two-mountain top (bottom), and a triple-mountain top (bottom) as shown in Figure 5. These three patterns may take anywhere from two weeks to several months to form, and generally show up quite well on a chart with a six-month duration.
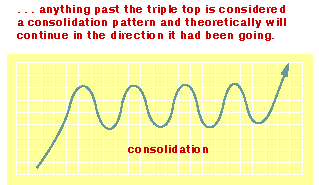
Figure 5: Reversals. This very basic definition of trends lends itself to Western trading patterns. The three-mountain reversal pattern (also called the Buddha pattern) is similar to the Western head and shoulders top; the double-top likewise appears in both cultures; and the dumpling top/frypan bottom is similar to a rounded top/bottom. Presumably anything that fails to reverse in three tries is no longer going to reverse, but enters a consolidation pattern (Figure 6).
Figure 6: Consolidation pattern. Generally, consolidation patterns should continue in the same direction they were going prior to the consolidation. Granted, that is a fairly large and glaring generality, but the engulfing pattern seems to be particularly strong in giving consistent signals in both trending and consolidation patterns, as shown in the following example.
MSFT ENGULFED
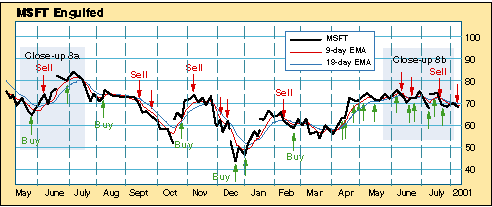
Figure 7: Fifteen-month chart of MSFT from May 2000 to July 2001 with arrows showing where all the engulfing patterns occurred, and which ones were followed. Figures 7A and 7B show closeups of the candlesticks during interesting trading periods.
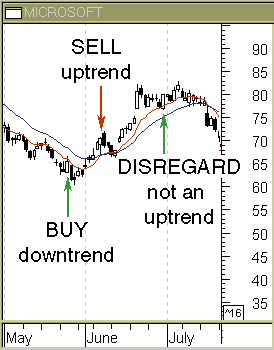
Figure 7A: Closeup of June-July MSFT candlestick patterns.
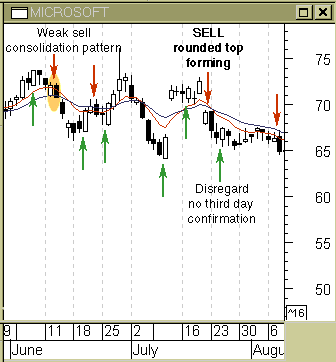
Figure 7B: Closeup of July-August MSFT candlestick patterns.
A 15-month chart of Microsoft Corp. (MSFT) from May 2000 to August 2001 is displayed in Figure 7. The upward-pointing green arrows in the chart are the engulfing pattern bull reversal signals, and the red arrows pointing downward are the bearish reversal patterns. These can be seen in Figures 7A and 7B. The highlighted arrows are engulfing patterns occurring in a trend, whose signals I determined were valid to follow. I decided I would buy in on the following day at approximately the opening prices. I rounded off all prices for simplicity. With an original investment of $1,000, my results were as follows:
Buy 64 Sell 79 $1,234 Buy 70 Sell 66 $1,163 Buy 64 Sell 68 $1,236 Buy 44 Sell 58 $1,630 Buy 55 Sell 67 $1,985
For the most part, like signals came in bunches, with buy signals following buys and sells reinforcing sells. One signal I did pass over was the buy signal in late June 2000 (Figure 7B). This buy signal seemed to appear in an uptrend or possibly a continuation pattern rather than in a downtrend. When in doubt, I look at confirming indicators. The MSFT chart has a nine- and 18-day exponential moving average (Ema). Emas are standard trend reversal indicators, and in the MSFT example, I can see the exponential moving average approximately reinforces the buy/sell signals provided by the engulfing patterns, except for the signal at the end of June. MSFT has just had a decent run up on the price and seems more likely to go down or consolidate rather than continue up. I bought in late August when I received a strong buy signal and MSFT seemed to be completing a bottom reversal pattern. As it turned out, it was the system's one losing trade. But it wasn't particularly catastrophic. I bought again in mid-February 2001, and from there until mid-June I received nothing but bullish engulfing pattern signals. In June a weak bearish engulfing pattern emerged. This one occurred in what looked like a consolidation pattern, so I decided not to sell. It was followed by a buy, and then another, more alarming bearish engulfing pattern. I could have sold at any one of these signals, but held on until the third sell signal, when MSFT seemed to be starting to drift down, forming a large top reversal pattern. Now that I had a clear reversal pattern, I sold the stock. During this time period, MSFT began around $65 and ended in August at about the same level. My initial $1,000 investment almost doubled using this system. Before using this system on Microsoft, I had looked at a number of stocks to see how well they worked with the engulfing pattern. Microsoft seemed to lend itself best to the pattern, and it was a fundamentally strong company.
ADDITIONAL TESTINGEven though the engulfing pattern worked very well on Microsoft, I wanted to backtest the pattern for the same 15 months using a more objective approach. My decisions to buy and sell were based on my ability to detect a trend, and there were too many instances where I wasn't confident in my choices. Backtesting using set rules to trade might give me a better system. At the very least, it would familiarize me with the engulfing pattern's tendencies. With that in mind, I went back and traded MSFT using the engulfing pattern only, leaving out any trend formations. I came up with the following results:
Buy 64 Sell 69 $1,234 Buy 77 Sell 66 $1,058 Buy 64 Sell 68 $1,124 Buy 44 Sell 56 $1,430 Buy 57 Sell 70 $1,757 Buy 69 Sell 69 $1,757 Buy 70 Sell 68 $1,706 Buy 65 Sell ??
I was very encouraged. Everything I've read suggests that the engulfing pattern could be profitable on its own with nothing else involved. It's a clean and simple trading system. But in examining each trade, I saw two obvious flaws. One was that the pattern needed a stop-loss (which all traders and investors should use anyway), and the other was that it was buying and selling while the stock was in a consolidation pattern. It was being whipsawed, confirming the need to trade only in a recognizable trend. I then conducted a second test that used a $5 trailing stop-loss (easier to calculate in the absence of a trading program than percentage stops), and decided to use a five-day minimum time span between trades. With these new rules, I got eight round-trip trades that turned the initial $1,000 into $1,764. This was slightly better than the engulfing system alone, but still inferior to the original trading system.
CONCLUSIONAlthough I would only fall back on using any of the backtested systems if I were unsure of interpreting a signal, they did help me by reinforcing the importance of placing a stop and the susceptibility of the engulfing pattern to whipsaws, and therefore the wisdom of trading this pattern in a trend. Both are valuable pieces of information as I continue to trade this candlestick pattern.
Sharon Yamanaka may be reached at SYamanaka@Traders.com.
SUGGESTED READINGYamanaka, Sharon [2001]. "Candlestick Close-up: Three White Soldiers," Working Money, Volume 2: May._____ [2001]. "Stocks And The Art Of Charts," Working Money, Volume 2: January/February.
Current and past articles from Working Money, The Investors' Magazine, can be found at Working-Money.com. |
| Title: | Staff Writer |
| Company: | Technical Analysis, Inc. |
| Address: | 4757 California AVE SW |
| Seattle, WA 98116 | |
| Phone # for sales: | 206 938 0570 |
| Fax: | 206 938 1307 |
| Website: | www.Working-Money.com |
| E-mail address: | syamanaka@traders.com |
Traders' Resource Links | |
| Charting the Stock Market: The Wyckoff Method -- Books | |
| Working-Money.com -- Online Trading Services | |
| Traders.com Advantage -- Online Trading Services | |
| Technical Analysis of Stocks & Commodities -- Publications and Newsletters | |
| Working Money, at Working-Money.com -- Publications and Newsletters | |
| Traders.com Advantage -- Publications and Newsletters | |
| Professional Traders Starter Kit -- Software | |
PRINT THIS ARTICLE

|

Request Information From Our Sponsors
- VectorVest, Inc.
- Executive Premier Workshop
- One-Day Options Course
- OptionsPro
- Retirement Income Workshop
- Sure-Fire Trading Systems (VectorVest, Inc.)
- Trading as a Business Workshop
- VectorVest 7 EOD
- VectorVest 7 RealTime/IntraDay
- VectorVest AutoTester
- VectorVest Educational Services
- VectorVest OnLine
- VectorVest Options Analyzer
- VectorVest ProGraphics v6.0
- VectorVest ProTrader 7
- VectorVest RealTime Derby Tool
- VectorVest Simulator
- VectorVest Variator
- VectorVest Watchdog
- StockCharts.com, Inc.
- Candle Patterns
- Candlestick Charting Explained
- Intermarket Technical Analysis
- John Murphy on Chart Analysis
- John Murphy's Chart Pattern Recognition
- John Murphy's Market Message
- MurphyExplainsMarketAnalysis-Intermarket Analysis
- MurphyExplainsMarketAnalysis-Visual Analysis
- StockCharts.com
- Technical Analysis of the Financial Markets
- The Visual Investor

