

HOT TOPICS LIST
- Strategies
- Stocks
- Buy
- Investing
- Brokers
- Psychology
- Interviews
- Accumulate
- Sell
- Hold
- Spotlight
- Websites
- Candlestick Corner
- Gold & Metals
- Options Trading
LIST OF TOPICS
TECHNICAL INDICATORS
A Taste Of The Big MACD
09/05/01 03:58:43 PM PSTby Amy Wu
Indicators like the moving average convergence/divergence help you confirm signals and decrease risk when buying and selling securities. Invented by Gerald Appel in the 1970s, the MACD has become a staple in the world of technical analysis. Here's how you can make use of it.
One of the most popular indicators used in technical analysis is the MACD (moving average convergence/divergence). In its most common form, the MACD is calculated by taking the difference between a 26-day and a 12-day exponential moving average. This difference, sometimes referred to as the price oscillator, will vary depending on the momentum of the security. A second line, called the signal or trigger line, is created by taking a nine-day exponential moving average of the price oscillator. The MACD is a trend-following indicator, moving in the direction of the prevailing price movement. This should be apparent, since it is based on moving averages that are calculated by using a security's price history. Since the price oscillator is the 12-day minus the 26-day exponential moving average, the difference of zero results in a horizontal line. Such a line indicates that the 26-day and the 12-day moving averages are changing at the same rate. In general, the quantity of the difference and whether it is positive or negative show how much faster or slower the exponential averages are moving relative to each other. EXPONENTIAL MOVING AVERAGESThe exponential moving average is a variation of the moving average. A simple moving average is just the arithmetic mean (or average) of a series of prices over a period of time. The exponential moving average is a weighted average; recent prices count more than previous prices. To calculate an exponential moving average, you apply a chosen percentage of today's close to yesterday's moving average. Suppose you wanted a 9% exponential moving average; 9% is the chosen weight you've assigned to the more recent price. You would multiply the security's close by 9% and add this to 91% multiplied by yesterday's moving average (100%-9%=91%): [Today's close * 0.9] + [yesterday's moving average * 0.91] As you may have noticed, the MACD uses days instead of percentages in its moving averages. This is just a convention used by investors, since days are more familiar as a variable. Use this equation to convert percentages to time periods: Time periods = (2/percentage)-1 Using the 9% example, this would give you [2/(0.09)] - 1, which equals 21.2 days. When the result is a decimal (for example, 21.2 days), round it to the nearest whole number (21 days). Because simple moving averages assign equal weighting, the number of days and the number of averages will be equal. But if you weight days differently, it is like giving some moving averages more days and some days less. Since the exponential moving average is a function of weight as opposed to days, the EMA days are not the same as those of the simple moving average. This calculation will give you a rough estimate of how many days the EMA is, depending on the percentage. INTERPRETATION OF THE MACDNow that you know what the MACD is and how to calculate it, you're probably wondering what it does. There are three major ways to use the MACD: identifying crossovers, finding overbought/oversold conditions, and tracking divergences. Crossovers: When the price oscillator falls below its signal line, the point of intersection is a crossover. These points are usually an indication to sell. Likewise, when the price oscillator rises above its signal line, this point of intersection shows a buy signal. These signals are fairly intuitive because they are derived from the momentum of relative moving averages. If the price oscillator is falling below its signal line, the 26-day exponential moving average is growing larger relative to the 12-day exponential moving average. As the difference of the price oscillator decreases, it suggests that the strength of a trend is waning. Buy/sell signals can also be generated using the zero line. When the price oscillator goes above or below this line, you get a buy or sell signal, respectively. Overbought/oversold conditions: Overbought and oversold conditions occur when prices have moved too far and too fast in either direction. This speed makes them vulnerable to reaction, such as corrections in the market. The MACD attempts to define the points where a security becomes overbought or oversold. For instance, when the shorter-term EMA diverges significantly from the longer-term EMA (in this case, the difference would be getting quite large; the MACD would be rising), it may be because the price of the security is overextended and will soon return to more normal levels. By using the buy/sell conditions, you can decide whether the MACD is showing a security as overbought or oversold. Divergences: Whereas convergences would move two related things closer together, divergences move them away from each other. When the MACD lines move in the opposite direction from the security price, it could mean that a current trend is at its end. A bearish divergence occurs when the MACD hits new lows but the prices do not hit new lows. A bullish divergence happens when the MACD hits new highs but the prices do not hit new highs. These divergences are most significant when they occur when the MACD is at overbought/oversold points.
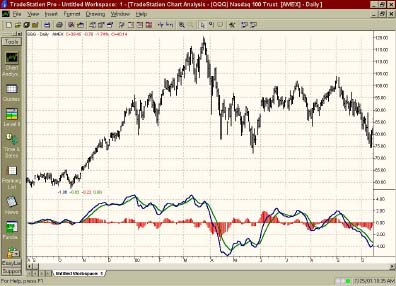
Figure 1: The MACD works well in uptrends. At the end of October 1999, the MACD lines went above the zero line and stayed above it until the QQQ (Nasdaq tracking index) plummeted. USING THE MACDThe MACD works well in trends and for long positions. It has shown good results when used on securities that tend to have longer-term trends, such as the currency commodity markets. When divergences occur within a trend, the MACD is less effective. One of the drawbacks of the MACD is that it can cause whipsaws because it tends to follow price movement even on rapid ups and downs. The MACD is depicted in two ways a line version and histogram version. In the line version, the price oscillator and signal are displayed as a line. On the histogram, the difference between the MACD and the signal is displayed as vertical bars, above or below the zero line. The MACD is found on most technical analysis software, in both the line and histogram versions. SUMMARYLike most indicators, the MACD is based on a few simple measurements: momentum, moving averages, divergences, and so forth. Also like most indicators, the MACD can fail you at times. It is always best to cross-reference indicators with others, or to use indicators as a confirmation (as opposed to as the entire rationale for a decision). Sometimes using indicators based on different measures can be helpful. If you get mutual confirmation from indicators that rely on different properties, you can drastically reduce your risk. In addition to the default 26- and 12-day MACD , other MACDs exist that take into account specific securities. Good luck and happy investing! Amy Wu is a student at Princeton University, majoring in economics and financial engineering. |
Amy Wu is a student at Princeton University, majoring in economics and financial engineering.
| Title: | Editorial, Intern |
| Company: | Technical Analysis, Inc. |
| Address: | 4757 California AVE SW |
| Seattle, WA 98116 | |
| Phone # for sales: | 206-938-0570 |
| Fax: | 206-938-1307 |
| Website: | www.traders.com |
| E-mail address: | AWu@traders.com |
Traders' Resource Links | |
| Charting the Stock Market: The Wyckoff Method -- Books | |
| Working-Money.com -- Online Trading Services | |
| Traders.com Advantage -- Online Trading Services | |
| Technical Analysis of Stocks & Commodities -- Publications and Newsletters | |
| Working Money, at Working-Money.com -- Publications and Newsletters | |
| Traders.com Advantage -- Publications and Newsletters | |
| Professional Traders Starter Kit -- Software | |
PRINT THIS ARTICLE

Request Information From Our Sponsors
- VectorVest, Inc.
- Executive Premier Workshop
- One-Day Options Course
- OptionsPro
- Retirement Income Workshop
- Sure-Fire Trading Systems (VectorVest, Inc.)
- Trading as a Business Workshop
- VectorVest 7 EOD
- VectorVest 7 RealTime/IntraDay
- VectorVest AutoTester
- VectorVest Educational Services
- VectorVest OnLine
- VectorVest Options Analyzer
- VectorVest ProGraphics v6.0
- VectorVest ProTrader 7
- VectorVest RealTime Derby Tool
- VectorVest Simulator
- VectorVest Variator
- VectorVest Watchdog
- StockCharts.com, Inc.
- Candle Patterns
- Candlestick Charting Explained
- Intermarket Technical Analysis
- John Murphy on Chart Analysis
- John Murphy's Chart Pattern Recognition
- John Murphy's Market Message
- MurphyExplainsMarketAnalysis-Intermarket Analysis
- MurphyExplainsMarketAnalysis-Visual Analysis
- StockCharts.com
- Technical Analysis of the Financial Markets
- The Visual Investor