

HOT TOPICS LIST
- Strategies
- Stocks
- Buy
- Investing
- Brokers
- Psychology
- Interviews
- Accumulate
- Sell
- Hold
- Spotlight
- Websites
- Candlestick Corner
- Gold & Metals
- Options Trading
LIST OF TOPICS
MONEY MANAGEMENT
The Right Mix
08/27/01 09:05:15 AM PSTby Sean Moore
Given their single-digit returns, are bonds worth investing in?
Even if you believe diversification is key when you're planning your investment portfolio, deciding how you are going to diversify your investments is a daunting task. If you invest in stocks, will you add bonds to your portfolio? Perhaps cash instruments such as certificates of deposit or money market accounts should play some role. Even within the world of stocks there is diversification by sector and by investment size or style (small-, medium- and large- capitalization stocks; growth, value, and balanced strategies). You can choose among aggressive stocks, high-dividend stocks, and global stocks. With so many options, trying to tailor a plan to meet your needs can be overwhelming at first. BONDS VS. STOCKSTo show the power of diversification, let's take a look at how a portfolio's performance changes when assets are allocated differently -- that is, when the weighting between stocks and bonds is changed. For example, stocks and stock funds are added to a portfolio to increase long-term capital appreciation, and bonds are often added for income, or interest-generated growth.To understand diversification between stocks and bonds, I looked at two Vanguard mutual funds. One of the funds, the Vanguard Standard & Poor's 500 (VFINX), invests in stocks and mimics the S&P 500. The other fund, the Vanguard Total Bond Market Index (VMBFX), invests in bonds and follows the Lehman Brothers Aggregate Bond Index. Since these funds follow their related benchmarks and have extremely low expense ratios (around 0.2%), they are appropriate for comparing asset allocation strategies between stocks and bonds. They also both accept minimum initial investments as low as $3,000 (though initial minimums can be lower for individual retirement accounts in many cases). Using Microsoft Excel, I compared a number of different asset allocations, using the VFINX and VMBFX funds as proxies for stock and bond holdings, respectively. Performance figures for both funds were culled from Morningstar.
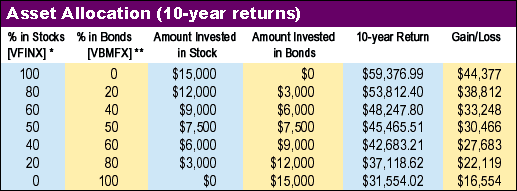 Amount Invested $15,000 Figure 1 shows the results of the long-term comparison (10 years). The portfolio with 100% stocks clearly outperformed the lowest equity allocation, 100% bonds, over the 10-year period. Figure 2 shows the performance of the same two funds over a shorter period, one year. Here, the performances are opposite of those shown in Figure 1. During this one-year period, the bond fund outperformed the stock fund. Bonds are generally considered less volatile than stocks. The backing of the "full faith and credit of the United States" gives Treasury bonds the standard risk-free rate of return against which all other investment returns can be measured. However, some types of bonds can be quite volatile. Corporate bonds issued by companies with poor credit ratings, high-yield or "junk" bonds, and even long-term US Treasury bonds can have large swings in price and yield from year to year.
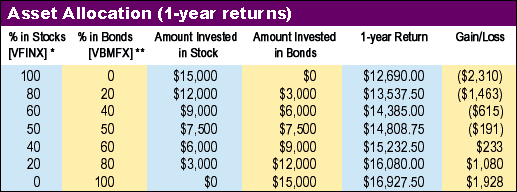 Amount Invested $15,000 The 10-year period used in Figure 1 includes the last stages of a major bull market, a time when most stocks appreciated quite well and bonds were largely overlooked as investments. Conversely, the one-year period includes the bear market that followed that major bull, a period in which bonds, understandably, became a good deal more popular as a safe haven. Over the long term, a portfolio consisting only of stocks is likely to outperform one with a percentage allocated to bonds, but as you can see from the results of the past year in Figure 2, bonds can be a safe haven during turbulent times. If you have an investment time horizon longer than 10 years, you can allocate 100% of your portfolio in stocks. But as that time horizon decreases, it's better to start adding bonds, so that when you are close to redeeming your investment there is a heavier allocation to bonds. SUMMARYFinding the right diversification plan will take both reflection and work. It's important to understand your goals, time horizon, and acceptable level of risk before making your final decision. If you do the research, you'll feel more comfortable with your choices and likely improve your chance for financial success.Sean Moore may be reached at SMoore@Traders.com. Current and past articles from Working Money, The Investors' Magazine, can be found at Working-Money.com. |
Traders.com Staff Writer.
| Title: | Project Engineer |
| Company: | Technical Analysis, Inc. |
| Address: | 4757 California Ave. SW |
| Seattle, WA 98116 | |
| Phone # for sales: | 206 938 0570 |
| Fax: | 206 938 1307 |
| Website: | www.traders.com |
| E-mail address: | smoore@traders.com |
Traders' Resource Links | |
| Charting the Stock Market: The Wyckoff Method -- Books | |
| Working-Money.com -- Online Trading Services | |
| Traders.com Advantage -- Online Trading Services | |
| Technical Analysis of Stocks & Commodities -- Publications and Newsletters | |
| Working Money, at Working-Money.com -- Publications and Newsletters | |
| Traders.com Advantage -- Publications and Newsletters | |
| Professional Traders Starter Kit -- Software | |
PRINT THIS ARTICLE

Request Information From Our Sponsors
- StockCharts.com, Inc.
- Candle Patterns
- Candlestick Charting Explained
- Intermarket Technical Analysis
- John Murphy on Chart Analysis
- John Murphy's Chart Pattern Recognition
- John Murphy's Market Message
- MurphyExplainsMarketAnalysis-Intermarket Analysis
- MurphyExplainsMarketAnalysis-Visual Analysis
- StockCharts.com
- Technical Analysis of the Financial Markets
- The Visual Investor
- VectorVest, Inc.
- Executive Premier Workshop
- One-Day Options Course
- OptionsPro
- Retirement Income Workshop
- Sure-Fire Trading Systems (VectorVest, Inc.)
- Trading as a Business Workshop
- VectorVest 7 EOD
- VectorVest 7 RealTime/IntraDay
- VectorVest AutoTester
- VectorVest Educational Services
- VectorVest OnLine
- VectorVest Options Analyzer
- VectorVest ProGraphics v6.0
- VectorVest ProTrader 7
- VectorVest RealTime Derby Tool
- VectorVest Simulator
- VectorVest Variator
- VectorVest Watchdog