

HOT TOPICS LIST
- Strategies
- Stocks
- Buy
- Investing
- Brokers
- Psychology
- Interviews
- Accumulate
- Sell
- Hold
- Spotlight
- Websites
- Candlestick Corner
- Gold & Metals
- Options Trading
LIST OF TOPICS
INVESTING
The Hidden Measure Of The Market
05/30/01 02:33:35 PM PSTby Dennis D. Peterson
Want to find out where the market is headed? Market breadth reveals plenty.
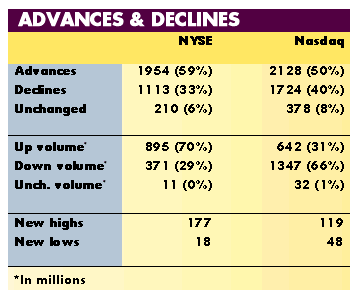
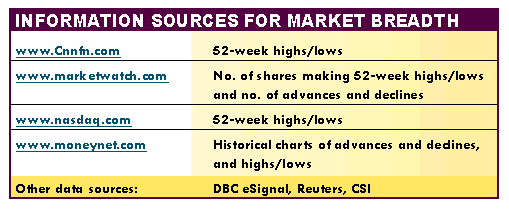
| Have you ever heard someone say that market breadth was good or bad and wondered what that meant? Maybe you've added the term to your list of inscrutable financial jargon -- yet another poorly explained concept that you assume is important, but don't have time to investigate. Well, that time has come. Understanding market breadth could change your investment strategy for good. According to The Wall Street Dictionary, the authority on vexing financial terms, market breadth is really just the number of shares trading during a certain time. It "refers to the overall strength and trading volume of the market by such measures as advance/decline figures and volume momentum." Okay, so what does that mean? If those measures sound complicated, don't give up yet -- details follow. BREADTH BACKGROUND The theory of market breadth originated among technical analysts, who study supply and demand of securities based on trading volume and price studies, rather than company fundamentals such as earnings and price/earnings ratios (P/Es). Technical analysts use market breadth to determine how strong a market is (often referred to as market enthusiasm) and to predict whether current market price trends will continue. As you already know, stock prices tend to fall when the market is bearish and rise when the market is bullish. A market can reflect bullish or bearish sentiment for the current quarter, a particular week, or even for one day. Market breadth measures just how bullish or bearish a market is. It can also tell you if stock prices are too high (overbought) or too low (oversold). How does market breadth accomplish all this? There's no magic formula, just careful analysis of several important market components. Market breadth looks at three measures of the market: the number of stocks making new 52-week highs and lows; the number of advancing and declining stocks; and the up volume and down volume, which measures the number of shares whose prices have increased or decreased. You can find information on these measures on the websites listed in the figure below, labeled Information Sources For Market Breadth. Many leading newspapers and financial websites also provide the daily advances and declines, as well as the up and down volume and the number of stocks making new yearly highs and lows. Yahoo!Finance provides all three measures, updated on a daily and intraday basis. The intraday data is delayed by 15 minutes. Just go to the Today's Markets section, click More, and you will see a display similar to that in the bottom figure below, labeled Advances & Declines. Get in the habit of recording these numbers every day in a spreadsheet -- it's easier than tracking them down later. 52-WEEK NEW HIGHS AND LOWS What are 52-week new highs and lows? The definition is straightforward; it's simply the number of stocks in a particular market -- such as the New York Stock Exchange (NYSE), the American Stock Exchange (AMEX), or the Nasdaq -- that have reached a new high or a new low in the last 52 weeks -- in the last year. The number is calculated each day. You can also find out how many stocks made new highs or lows for the week, month, or quarter. When the number of 52-week highs is greater than the number of lows, it suggests that the market is generally in a bullish mood. For a more precise measure, calculate the ratio of new highs/(new highs+new lows) and compare today's ratio to an average of the last five or 10 days. By comparing today's ratio to the average ratio, you are measuring market momentum -- that is, the way price changes over time. Decreasing momentum is a sign that the price could reverse soon. Increasing momentum is bullish. Use 52-week highs and lows as a high-level sentiment indicator. You'll need to look at a few other measures, also, before you jump to any conclusions. Once you have recorded the 52-week highs and lows, the next step is to record the number of advances and declines. ADVANCES AND DECLINES The market breadth measure you probably hear about the most in the financial news is the number of advancing and declining stocks. It is calculated each trading day by tallying the number of stocks whose price increased and the number whose price decreased. With the right software and data source, such as DBC's eSignal, Reuters, or CSI, you can get a running tally of advancing and declining issues in real time. In using this technique, try to determine if there is a trend in the numbers. If more and more stocks are seeing higher prices as time passes, then it would appear there is positive momentum in the market. In the same way, declining stock prices would suggest negative momentum. The difference between the number of stocks that are moving up and those that are declining measures the strength of this momentum. If the difference is increasing, it means the market is bullish. If it is decreasing, it means the market is bearish. Again, you'll get a better measure of momentum if you calculate the average difference and compare it to today's difference.
You will find that in most cases, momentum moves up with the market. But there may be times when prices will continue to move up while momentum declines. This can be an effective warning signal of a decline in prices. (For more information on determining the momentum of price change, see "Which Way Will The Market Go?" at www.working-money.com.)
Use the five-day average of advances minus declines to determine if you are in an upswing or downswing. An upswing in a bear market means a temporary rise in prices, while an upswing in a bull market is just more of the same. UP AND DOWN VOLUME Last but not least, record the up volume (the number of traded shares whose price increased compared to yesterday's close or today's open) and down volume (the number of traded shares whose price decreased). Up and down volume will help you determine if prices are overbought or oversold. To make the most effective use of this measurement, calculate the three-day average of the ratio (up/up+down) and compare the average to a threshold, such as 0.7 and 0.3 for the upper and lower thresholds, respectively. If the average is greater than the upper threshold, stocks are overbought. If the average is below the threshold, stocks are oversold. When you measure up and down volume, you may notice some strange behavior. For example, you may see it begin to trend down before prices start to go down. This suggests that market participants aren't so exuberant about buying, even though prices are still moving up. This could be a warning signal! If you don't take heed and sell your positions, you may find your portfolio tumbling along with the market. SUMMARY Of the three breadth measures, 52-week highs and lows change the slowest. For that reason, sometimes the buy and sell signals they generate will be late. But therein lies the measure's strength. Use 52-week highs and lows to determine overall market mood (bullish versus bearish), then use advances and declines as a more time-sensitive refinement, ultimately going to up and down volume for the most timely information. Together, these three indicators can tell you, for example, that the market is in a bearish mood but currently has taken a bullish upswing, and that stocks are currently overbought. Several possibilities exist on any one day. By using these three breadth measures and recording the numbers you get in a spreadsheet, you'll get a better insight into where the market is headed. Dennis Peterson can be reached at DPeterson@Traders.com. Current and past articles from Working Money, The Investors' Magazine, can be found at Working-Money.com. SUGGESTED READING Peterson, Dennis D. [2001]. "Which Way Will The Market Go?" Working Money, Volume 2: April. |
Market index trading on a daily basis.
| Title: | Staff Writer |
| Company: | Technical Analysis, Inc. |
| Address: | 4757 California Ave SW |
| Seattle, WA 98116-4499 | |
| Phone # for sales: | 206 938 0570 |
| Fax: | 206 938 1307 |
| Website: | working-money.com |
| E-mail address: | dpeterson@traders.com |
Traders' Resource Links | |
| Charting the Stock Market: The Wyckoff Method -- Books | |
| Working-Money.com -- Online Trading Services | |
| Traders.com Advantage -- Online Trading Services | |
| Technical Analysis of Stocks & Commodities -- Publications and Newsletters | |
| Working Money, at Working-Money.com -- Publications and Newsletters | |
| Traders.com Advantage -- Publications and Newsletters | |
| Professional Traders Starter Kit -- Software | |
PRINT THIS ARTICLE

Request Information From Our Sponsors
- StockCharts.com, Inc.
- Candle Patterns
- Candlestick Charting Explained
- Intermarket Technical Analysis
- John Murphy on Chart Analysis
- John Murphy's Chart Pattern Recognition
- John Murphy's Market Message
- MurphyExplainsMarketAnalysis-Intermarket Analysis
- MurphyExplainsMarketAnalysis-Visual Analysis
- StockCharts.com
- Technical Analysis of the Financial Markets
- The Visual Investor
- VectorVest, Inc.
- Executive Premier Workshop
- One-Day Options Course
- OptionsPro
- Retirement Income Workshop
- Sure-Fire Trading Systems (VectorVest, Inc.)
- Trading as a Business Workshop
- VectorVest 7 EOD
- VectorVest 7 RealTime/IntraDay
- VectorVest AutoTester
- VectorVest Educational Services
- VectorVest OnLine
- VectorVest Options Analyzer
- VectorVest ProGraphics v6.0
- VectorVest ProTrader 7
- VectorVest RealTime Derby Tool
- VectorVest Simulator
- VectorVest Variator
- VectorVest Watchdog