

HOT TOPICS LIST
- Strategies
- Stocks
- Buy
- Investing
- Brokers
- Psychology
- Interviews
- Accumulate
- Sell
- Hold
- Spotlight
- Websites
- Candlestick Corner
- Gold & Metals
- Options Trading
LIST OF TOPICS
INVESTING
Interpret Stock Prices With MACD
05/01/01 10:57:22 AM PSTby Dennis D. Peterson
This popular tool to interpret stock prices is one of the staples of the technical analyst. Is it right for you?
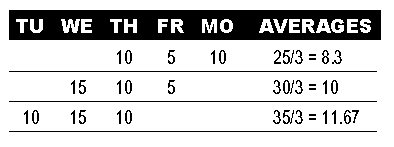
| Stock prices are a language all their own. Need help to understand what they're saying? It's not a crystal ball or a universal translator, but a tool that measures the enthusiasm behind price movement. It's a technical indicator known as the moving average convergence/divergence (MACD). It's popular and it's well known, not to mention readily available; a large number of Internet charting sites offer it. To understand how and why MACD is so effective in interpreting stock prices, it is necessary to understand what moving averages are, how they behave, and how they are built. Once you have this knowledge, you will be able to better understand the MACD. WHAT IS A MOVING AVERAGE? A moving average is, as you can infer from the name, an average. It is calculated by taking a sum of the prices over the most recent period of time, say, the last 10 days, and dividing that sum by the number of days used, in this case 10. It is referred to as "moving" because it is a price average that is continuously adjusted, with a new price added on reflecting a changing average. Figure 1 shows the three-day moving average calculated for three days. The average for each day is different because each day you eliminate one day - the oldest.
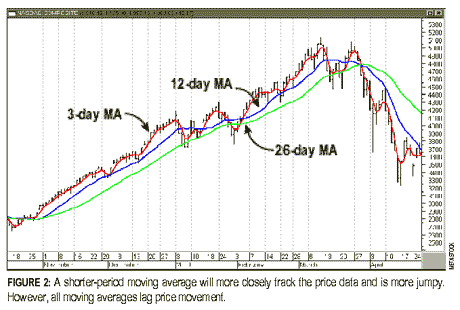
If prices are heading down, so is the moving average. Conversely, if prices are headed up, the average will too. When stocks move up or down consistently in one prevailing direction, they are in a trend. Moving averages are trend-following indicators. That means a moving average goes up when a stock is in an uptrend (prices rising) and down when a stock is in a downtrend (prices declining). When you use a period with many days to calculate the moving average, you are summing a large set of numbers. Moving from day to day, dropping off the oldest day and adding the most recent, usually won't make a big difference in the final sum nor, consequently, in the average. What you will see is an average that rolls gently along, such as the green line - the 26-day simple moving average (Figure 2). However, when you use a shorter period, your sum has fewer numbers; thus, each day's data has a bigger influence, such as the blue line - the 12-day simple moving average. When you use just a few days - say, three (red line) - the ups and downs of each day's data have a big influence. It's no longer the nice rolling moving average, but an average that jumps around to match the jumpiness of the underlying data. Technical analysts recognized long ago that moving averages need shorter periods to more closely track the data. In a simple moving average, the closing price of each day has the same weight. The Macd, on the other hand, uses an exponential moving average as opposed to a simple moving average. The exponential moving average is calculated by placing more emphasis on the most recent measurement. This gives you the smoothness of a simple moving average and the closer tracking of a shorter-period average. LEADING AND LAGGING When you examine Figure 2 closely, you'll see how the moving averages go down after the price goes down, and turn up only after the price turns up. Even the three-day simple moving average that tracked the price changes reasonably well was consistently late, albeit slightly. Using an exponential moving average will help alleviate the time lag problem, but it won't completely eliminate it. All moving averages lag price movement, which is why they fall into the class of lagging indicators - the indicator equivalent of hindsight.
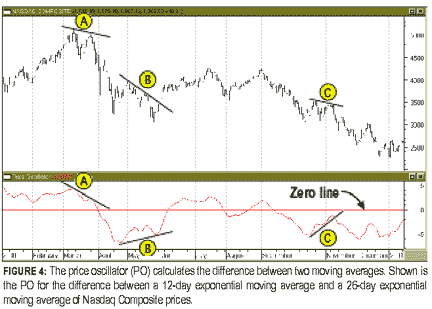
If moving averages lag, why use them at all? There's a good reason: they remove "jumpiness," or volatility in the data. Moving averages also show the movement of the underlying price, so you can get a visual cue as to how the price is reacting. If at all possible, what you would prefer is a leading indicator - one that tells you ahead of time what might happen to prices. Let's pause here, because this is likely to be the topic most prone to misunderstanding. Some market participants will say it is not possible to know price action ahead of time, and often, in the same breath, say the market is just emotion. But it is emotion that makes leading indicators possible. Price will sometimes continue upward even when the emotion affecting the market has lessened. The leading indicator attempts to measure that enthusiasm, and it is your task to know the correct conditions for using the leading indicator. In order to build a leading indicator, you need to compare performance between different points in time. Suppose that 30 days ago prices were increasing 10% on average, 20 days ago they were increasing 5% on average, and 10 days ago only 1%. This means that enthusiasm (or momentum) is lessening. (For related articles explaining market momentum, search for "momentum" on the Working Money website, www.working-money.com.) MEASURING MOMENTUM The difference between two moving averages would give you a measure of momentum of the stock. (See Figure 3.) If a shorter-period moving average of price is above a longer-period moving average, this means that the more recent prices tend to be higher than the older ones. 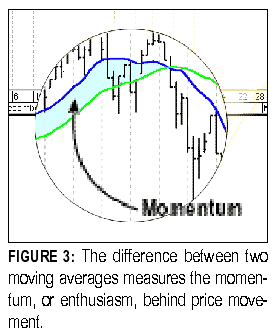 An indicator that measures the difference between two moving averages is the price oscillator (PO). (As a rule, all indicators that measure momentum are referred to as oscillators.) Figure 4 shows the difference between a 12-day and 26-day exponential moving average for the Nasdaq Composite. To understand how this momentum is measured, compare the peaks and valleys between prices and the price oscillator. Take a look at the areas marked A, B, and C. The direction of the slope of the trendlines at these three points is significant; the slopes for all three lines are different between the PO and the Nasdaq Composite. While the price trend A was showing some decline, the momentum was in serious decline. At B, while the Nasdaq price trend was still going down, the trend of the PO was going up. At C, the negative downtrend lessened in the Nasdaq, taking a short breather before continuing to go down while the PO was going up.
This relationship has been observed in stock price movements for decades, but that doesn't mean it is the end-all and be-all for predicting stock movement. In fact, there is no end-all and be-all. Although momentum generally leads price change, that isn't always the case. This is evident at point C, where the direction of price movement wasn't predicted correctly. Why? To answer this question, you need to understand the MACD. MACD The MACD is displayed as two lines (Figure 5). (It can also be displayed as a histogram, but we will discuss only the line form in this article.) It is made up of the price oscillator (solid line) and the moving average of the price oscillator (dashed line). The price oscillator is referred to as the MACD line. The dashed line, which is the exponential moving average of the price oscillator, is referred to as the signal line. 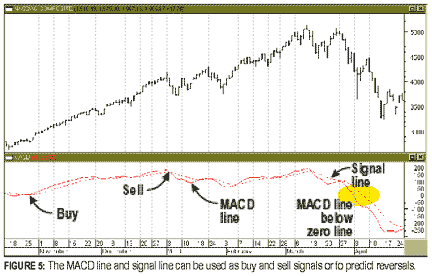 By using the price oscillator and the exponential moving average of the price oscillator, the MACD compares prices at two different points in time and hence measures the momentum of the trend. Use the signal line as a reference to determine whether enthusiasm is increasing or decreasing. Typically, 12 and 26 days are used for the two exponential moving averages of the price oscillator (the same as the examples given) and nine for the signal line. USING THE MACD The MACDcan be useful in determining whether to buy a stock. Some users of the MACD opine that a buy signal occurs when the MACD crosses above its signal line (which is the same as saying that the price oscillator is above its exponential moving average) and a sell signal occurs when MACD is below its signal line. If you were to blindly abide by this rule, however, you could make some ruefully unprofitable investments. To overcome this problem, I place more emphasis on the relationship of the MACD and signal line to the zero line. As you can see from the chart, the MACD moves above and below the zero line, which is a constant with zero value (in essence, a point of reference). When the MACD and its signal line move above the zero line, prices are trending up. They will continue to rise as long as the MACD continues to go up and stay positive. When MACD and its signal line are below the zero line, that means prices are declining, but I usually do not wait till the lines are below the zero line before selling. Instead, I sell when MACD crosses below its signal line, even if it is above the zero line. One reason to use MACD only when it is above the zero line is that stocks spend more time going up than they do going down. If an indicator lags, then you need to wait for the sell signal. This means your sell signals will be correct more often if you wait when you are in an uptrend - when the MACD is above the zero line. If during a downtrend you decide to wait and see if prices go down, you may find yourself missing the signal because the stock will go down too quickly. This will delay your selling of the stock. The MACD can be used to signal market reversals. When prices move in one direction and the MACD moves in the opposite direction, it could mean that prices will reverse. If the market moves to new highs or new lows and the MACD fails to better the previous high or low, the market is likely to reverse. In this particular case in Figure 5, prices were trending down. Therefore, the divergence in the MACD suggests that prices could start moving up, which they did for a short time. SUMMARY You can learn a lot from indicators like the MACD. Their usefulness goes beyond just buy and sell signals; they are good at signaling the beginning of trends, and they can also indicate the start of price reversals. The MACD measures momentum by comparing what has happened at two different points in time. It is an effective indicator to use when prices are in a positive trend. Since stocks spend 50% or less of their time in a trend, your use of the MACD will be limited, but it would be more useful to use it than not at all. Dennis Peterson can be reached at DPeterson@Traders.com. SUGGESTED READING Peterson, Dennis D. [2001]. "Which Way Will The Market Go?" Working Money, Volume 2: April. This article and other articles like it may be found at our website, www.working-money.com.
Copyright © 2001 Technical Analysis, Inc. All rights reserved.
|
Market index trading on a daily basis.
| Title: | Staff Writer |
| Company: | Technical Analysis, Inc. |
| Address: | 4757 California Ave SW |
| Seattle, WA 98116-4499 | |
| Phone # for sales: | 206 938 0570 |
| Fax: | 206 938 1307 |
| Website: | working-money.com |
| E-mail address: | dpeterson@traders.com |
Traders' Resource Links | |
| Charting the Stock Market: The Wyckoff Method -- Books | |
| Working-Money.com -- Online Trading Services | |
| Traders.com Advantage -- Online Trading Services | |
| Technical Analysis of Stocks & Commodities -- Publications and Newsletters | |
| Working Money, at Working-Money.com -- Publications and Newsletters | |
| Traders.com Advantage -- Publications and Newsletters | |
| Professional Traders Starter Kit -- Software | |
PRINT THIS ARTICLE

Request Information From Our Sponsors
- VectorVest, Inc.
- Executive Premier Workshop
- One-Day Options Course
- OptionsPro
- Retirement Income Workshop
- Sure-Fire Trading Systems (VectorVest, Inc.)
- Trading as a Business Workshop
- VectorVest 7 EOD
- VectorVest 7 RealTime/IntraDay
- VectorVest AutoTester
- VectorVest Educational Services
- VectorVest OnLine
- VectorVest Options Analyzer
- VectorVest ProGraphics v6.0
- VectorVest ProTrader 7
- VectorVest RealTime Derby Tool
- VectorVest Simulator
- VectorVest Variator
- VectorVest Watchdog
- StockCharts.com, Inc.
- Candle Patterns
- Candlestick Charting Explained
- Intermarket Technical Analysis
- John Murphy on Chart Analysis
- John Murphy's Chart Pattern Recognition
- John Murphy's Market Message
- MurphyExplainsMarketAnalysis-Intermarket Analysis
- MurphyExplainsMarketAnalysis-Visual Analysis
- StockCharts.com
- Technical Analysis of the Financial Markets
- The Visual Investor