HOT TOPICS LIST
- Strategies
- Stocks
- Buy
- Investing
- Brokers
- Psychology
- Interviews
- Accumulate
- Sell
- Hold
- Spotlight
- Websites
- Candlestick Corner
- Gold & Metals
- Options Trading
LIST OF TOPICS
PRINT THIS ARTICLE
by Han Kim
We elect a President every four years. How does that affect your portfolio?
Han Kim
Staff Writer
PRINT THIS ARTICLE
INVESTING
Profiting In A Presidential Cycle
10/24/00 03:27:08 PM PSTby Han Kim
We elect a President every four years. How does that affect your portfolio?
| If you knew exactly what the market was going to do this election year, what would you do? Would you try to optimize your portfolios, reallocate your available funds, reorganize your 401(k) and Iras, or would you keep it all in cash? Whatever you chose, you would need to know how the Presidential election cycle affected your money. The future is a mystery, but you do have its footprints in the past as a clue. |
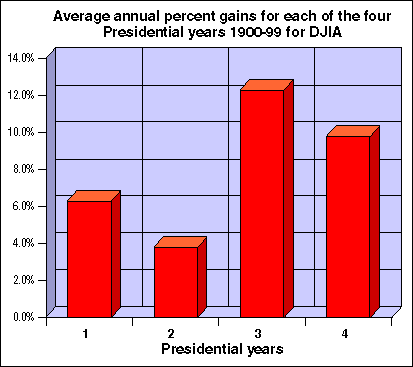
| Over the last century or so, the stock market has performed in a cyclical fashion according to the Presidential cycle. It is a distinct pattern in which during the first two years of the cycle, the market does not perform as well as the previous two years of the preceding Presidency (Figure 1). Once you know that this cycle has been going on for at least 100 years, here's how you can profit from it. |

|
| FIGURE 1: AVERAGE ANNUAL CHANGE FOR DJIA ACCORDING TO THE FOUR-YEAR PRESIDENTIAL CYCLE, 1900-99. The first year of the Presidential cycle is the first year following the election year and the election year is year 4 of the Presidential cycle. |
| |
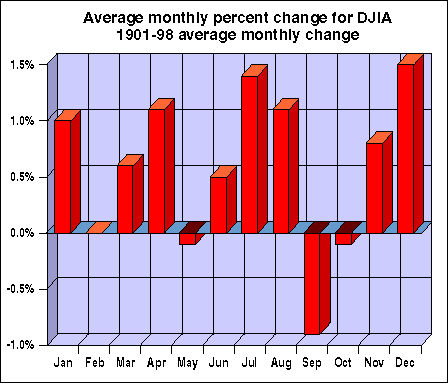
| The DJIA First, take a look at the average percent change in the Dow Jones Industrial Average (Djia) for each month of the calendar year from 1901 to 1998 (Figure 2). There are some months that perform better than others, overall, but there appears to be no real pattern. However, if you take the data and analyze it according to the four-year Presidential cycle, a pattern appears (Figure 3). "Stocks tend to advance most during the year immediately preceding and the year of the election, but only tread water during the other two years of the four-year cycle," noted Mark Vakkur, author of "Seasonality And The Presidential Election Cycle." Upon close examination, it becomes apparent that the first half of the first Presidential year slowly increases, but from the second half of that year through the third quarter of the second Presidential year, the market does indeed only appear to "tread water." Not until the fourth quarter of the second Presidential year does the market start its big rally. For the next 10 months of the Presidential term, the market makes its biggest gain of the cycle, followed by another 10 months of again much lesser activity, leading into the election year. The second rally comes in the second half of the election year. |
| Know when How can you benefit from this knowledge? Knowing when to be in the market is the key. Investing during the months in which the market does not do much wouldn't make much sense (nor dollars). Clearly, you want to be in the market when the market is going up. Look back at how the Djia has done with respect to the Presidential cycle (Figure 3), and it becomes clear when the market does well and when the market does not. On average for the last century, the third and fourth years of the Presidential cycle have been much more profitable than the first two years. Where should you put your money during those times when the market is not doing that much? You may want to put it into low-risk investments, such as certificates of deposit (CDs) and Treasury bills. While these low-risk investments may not make returns as high as the market could during those months of spectacular performance, they are safer places to be than the markets during the not-so-good months of the Presidential cycle.  Figure 2: Monthly average percent change, DJIA, 1901-98. This represents the average percent change in each month of a calendar year for the DJIA from January 1901 through December 1998.  FIGURE 3: AVERAGE PERCENT. This shows the average percent above December 31 of the preceding election year for the DJIA from 1900 through 1999. If you were to follow the Presidential cycle, you could invest your money in CDs or T-bills most of the first two years, then invest in the stock market most of the latter two years. Investing your money in the market when the market is performing well and in low-risk investments when the market is not should help you make a greater profit. |
| Related reading Vakkur, Mark [1996]. "Seasonality And The Presidential Election Cycle," Technical Analysis of Stocks & Commodities, Volume 14: October. |
Staff Writer
| Title: | Webmaster |
| Company: | Technical Analysis, Inc. |
| Address: | 4757 California AVE SW |
| Seattle, WA 98116 | |
| Phone # for sales: | 206-938-0570 |
| Fax: | 206-938-1307 |
| Website: | working-money.com |
| E-mail address: | hkim@traders.com |
Traders' Resource Links | |
| Charting the Stock Market: The Wyckoff Method -- Books | |
| Working-Money.com -- Online Trading Services | |
| Traders.com Advantage -- Online Trading Services | |
| Technical Analysis of Stocks & Commodities -- Publications and Newsletters | |
| Working Money, at Working-Money.com -- Publications and Newsletters | |
| Traders.com Advantage -- Publications and Newsletters | |
| Professional Traders Starter Kit -- Software | |
PRINT THIS ARTICLE

|

Request Information From Our Sponsors
- VectorVest, Inc.
- Executive Premier Workshop
- One-Day Options Course
- OptionsPro
- Retirement Income Workshop
- Sure-Fire Trading Systems (VectorVest, Inc.)
- Trading as a Business Workshop
- VectorVest 7 EOD
- VectorVest 7 RealTime/IntraDay
- VectorVest AutoTester
- VectorVest Educational Services
- VectorVest OnLine
- VectorVest Options Analyzer
- VectorVest ProGraphics v6.0
- VectorVest ProTrader 7
- VectorVest RealTime Derby Tool
- VectorVest Simulator
- VectorVest Variator
- VectorVest Watchdog
- StockCharts.com, Inc.
- Candle Patterns
- Candlestick Charting Explained
- Intermarket Technical Analysis
- John Murphy on Chart Analysis
- John Murphy's Chart Pattern Recognition
- John Murphy's Market Message
- MurphyExplainsMarketAnalysis-Intermarket Analysis
- MurphyExplainsMarketAnalysis-Visual Analysis
- StockCharts.com
- Technical Analysis of the Financial Markets
- The Visual Investor
