

HOT TOPICS LIST
- MACD
- Fibonacci
- RSI
- Gann
- ADXR
- Stochastics
- Volume
- Triangles
- Futures
- Cycles
- Volatility
- ZIGZAG
- MESA
- Retracement
- Aroon
INDICATORS LIST
LIST OF TOPICS
PRINT THIS ARTICLE
by Stella Osoba, CMT
Eli Lilly & Co.(LLY) is a large cap pharmaceutical company in the health care sector. As well as the maker of many popular drugs, LLY is also the maker of Zepbound, the popular weight loss drug. Let's take a look at its price charts.
Position: N/A
Stella Osoba, CMT
Stella Osoba is a trader and financial writer. She is a frequent contributor to "Technical Analysis of Stocks and Commodities" magazine and "Traders.com Advantage" as well as other financial publications.
PRINT THIS ARTICLE
TECHNICAL ANALYSIS
Eli Lilly
01/30/25 03:25:08 PMby Stella Osoba, CMT
Eli Lilly & Co.(LLY) is a large cap pharmaceutical company in the health care sector. As well as the maker of many popular drugs, LLY is also the maker of Zepbound, the popular weight loss drug. Let's take a look at its price charts.
Position: N/A
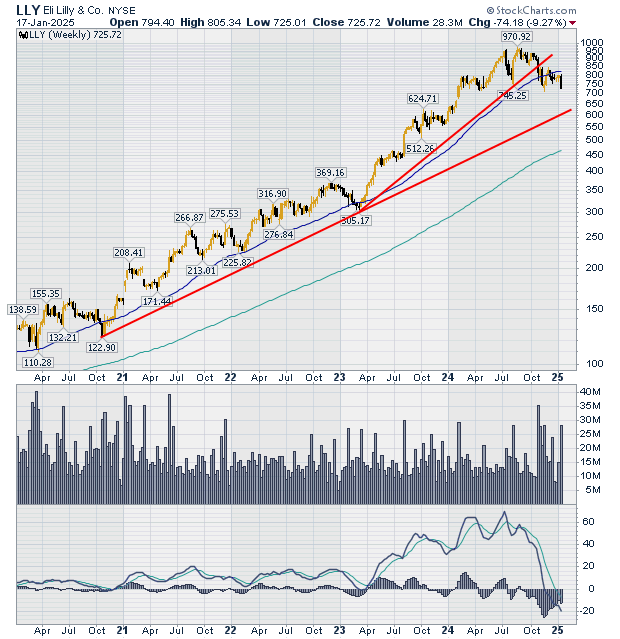
| Figure 1 shows that LLY shares had been on a long-term uptrend over the last four years. Shares rose from $122 in October 2020 up to $970 in August 2024, A whopping 695% increase. Figure 1 shows the uptrend lines marking the remarkable rise of this stock. |
|
| Figure 1. Weekly chart for LLY. |
| Graphic provided by: StockCharts.com. |
| |
| But $970 proved to be LLY's high and shares began to retreat after the August 22, 2024 highs. The August 22 high was the second peak of a double top price pattern. The first top had been completed in July of that year. |
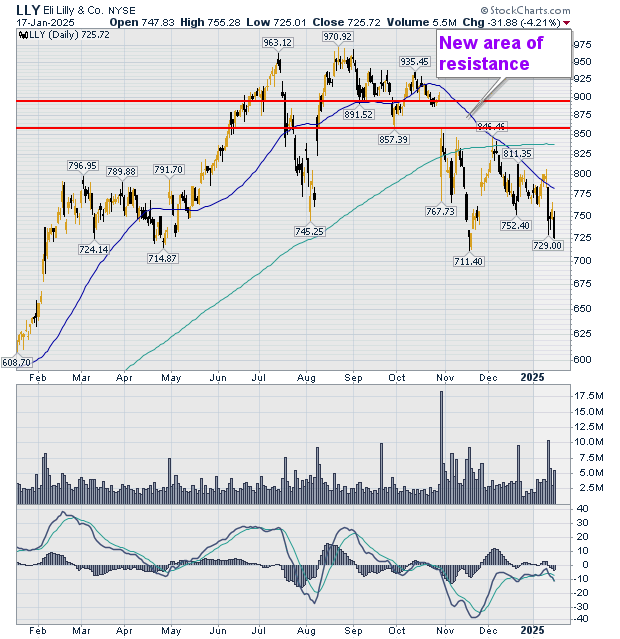
| Figure 2 is a daily chart showing one year of price history. After the double top, price made two lower highs before gapping down on heavy volume. The whole area of the gap down now becomes new resistance. |
|
| Figure 2. Daily chart for LLY. |
| Graphic provided by: StockCharts.com. |
| |
| After the gap down seen in Figure 2, price fell to a low of $711 and then climbed higher, but the rise failed at resistance. Notice how the 200-day moving average moved above the 50-day moving average completing a death cross. Price has since continued to fall on rising volume. The price chart is clearly currently showing bearish price action. Going long this stock would be premature based on the technicals. The downtrend may be a reaction or a reversal. Impossible to tell with such limited price action after the breakdown. A reaction would mean that the decline is limited and price will eventually resume the uptrend. A reversal would mean a longer-term decline with price entering a downtrend. |
| Nothing in this article is a recommendation to go long or short this stock. This article is intended for educational purposes only. |
Stella Osoba is a trader and financial writer. She is a frequent contributor to "Technical Analysis of Stocks and Commodities" magazine and "Traders.com Advantage" as well as other financial publications.
| E-mail address: | stellaosoba@gmail.com |
Click here for more information about our publications!
PRINT THIS ARTICLE

Request Information From Our Sponsors
- StockCharts.com, Inc.
- Candle Patterns
- Candlestick Charting Explained
- Intermarket Technical Analysis
- John Murphy on Chart Analysis
- John Murphy's Chart Pattern Recognition
- John Murphy's Market Message
- MurphyExplainsMarketAnalysis-Intermarket Analysis
- MurphyExplainsMarketAnalysis-Visual Analysis
- StockCharts.com
- Technical Analysis of the Financial Markets
- The Visual Investor
- VectorVest, Inc.
- Executive Premier Workshop
- One-Day Options Course
- OptionsPro
- Retirement Income Workshop
- Sure-Fire Trading Systems (VectorVest, Inc.)
- Trading as a Business Workshop
- VectorVest 7 EOD
- VectorVest 7 RealTime/IntraDay
- VectorVest AutoTester
- VectorVest Educational Services
- VectorVest OnLine
- VectorVest Options Analyzer
- VectorVest ProGraphics v6.0
- VectorVest ProTrader 7
- VectorVest RealTime Derby Tool
- VectorVest Simulator
- VectorVest Variator
- VectorVest Watchdog