

HOT TOPICS LIST
- MACD
- Fibonacci
- RSI
- Gann
- ADXR
- Stochastics
- Volume
- Triangles
- Futures
- Cycles
- Volatility
- ZIGZAG
- MESA
- Retracement
- Aroon
INDICATORS LIST
LIST OF TOPICS
PRINT THIS ARTICLE
by Stella Osoba, CMT
With its recent V-shaped recovery is Lululemon (LULU) worth watching right now?
Position: N/A
Stella Osoba, CMT
Stella Osoba is a trader and financial writer. She is a frequent contributor to "Technical Analysis of Stocks and Commodities" magazine and "Traders.com Advantage" as well as other financial publications.
PRINT THIS ARTICLE
TECHNICAL ANALYSIS
Lululemon's V-Shaped Recovery
02/27/25 01:55:12 PMby Stella Osoba, CMT
With its recent V-shaped recovery is Lululemon (LULU) worth watching right now?
Position: N/A
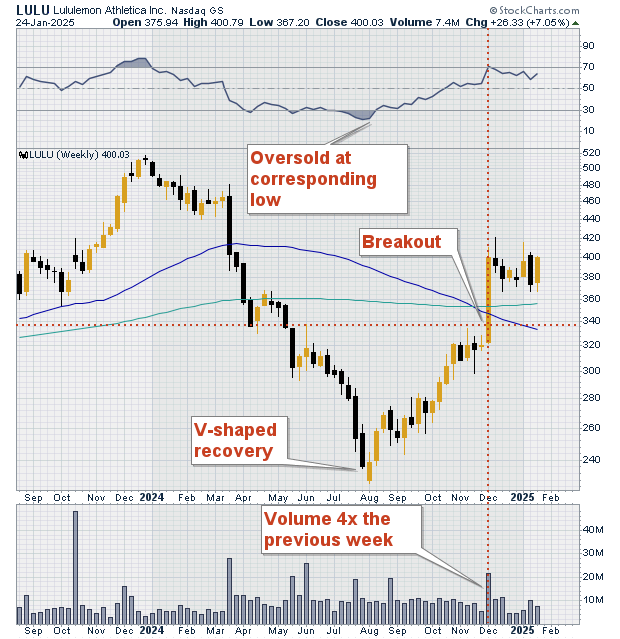
| Figure 1 is a weekly chart of LULU's share price charting its downtrend and subsequent recovery. In December 2023, LULU was trading at over $500 per share. But soon the stock began to swoon and price began trading lower before plunging below the 50-day moving average in March of 2024. |
|
| Figure 1. Weekly chart for LULU. |
| Graphic provided by: StockCharts.com. |
| |
| LULU's descent took it from a high of $516.39 in December 2023 to a low of $226.01 in March 2024, a 56% loss. But then in August of that year the downtrend reversed in a V-shaped recovery and price began to rise as quickly as it had fallen. The rise was so quick that the moving averages which are lagging indicators have as yet to respond. Figure 1 shows that the death cross is completed as the stock continues to rise in price. (a death cross is a negative signal showing the slower moving average rising above the faster moving average). |
| Figure 1 also shows a breakout of price with a strong bullish candle forming, rising above the prior high on 4x the volume of the prior week. This is extremely bullish price activity. |
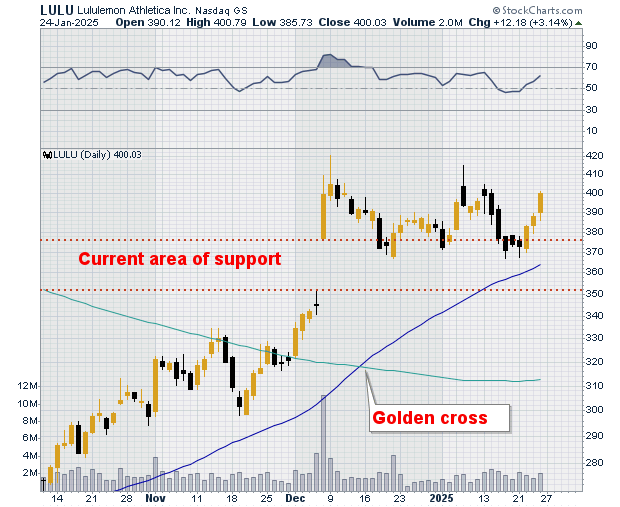
| Figure 2 is a daily chart showing around three months of price activity. It shows further bullish action. The gap up in December on strong volume has created a new zone of support. As price has subsequently traded sideways, it is using the area of the gap up as support. Price has dipped three times into the upper area of the zone but has not fallen below the lower line of the gap up. If it does this, the gap is closed and the area will no longer be considered support. Also, note how on the daily chart the 50-day moving average crossed over the 200-day moving average creating a bullish golden cross, the opposite of what has occurred on the weekly chart (Figure 1). |
|
| Figure 2. Daily chart for LULU. |
| Graphic provided by: StockCharts.com. |
| |
| LULU's price chart is showing positive price action. But it is not historical data that controls. Traders watch price charts carefully because prior positive price action can change suddenly in the other direction. Watch for signs of continued positive price action before making a decision about whether to enter a trade. |
Stella Osoba is a trader and financial writer. She is a frequent contributor to "Technical Analysis of Stocks and Commodities" magazine and "Traders.com Advantage" as well as other financial publications.
| E-mail address: | stellaosoba@gmail.com |
Click here for more information about our publications!
PRINT THIS ARTICLE

Request Information From Our Sponsors
- StockCharts.com, Inc.
- Candle Patterns
- Candlestick Charting Explained
- Intermarket Technical Analysis
- John Murphy on Chart Analysis
- John Murphy's Chart Pattern Recognition
- John Murphy's Market Message
- MurphyExplainsMarketAnalysis-Intermarket Analysis
- MurphyExplainsMarketAnalysis-Visual Analysis
- StockCharts.com
- Technical Analysis of the Financial Markets
- The Visual Investor
- VectorVest, Inc.
- Executive Premier Workshop
- One-Day Options Course
- OptionsPro
- Retirement Income Workshop
- Sure-Fire Trading Systems (VectorVest, Inc.)
- Trading as a Business Workshop
- VectorVest 7 EOD
- VectorVest 7 RealTime/IntraDay
- VectorVest AutoTester
- VectorVest Educational Services
- VectorVest OnLine
- VectorVest Options Analyzer
- VectorVest ProGraphics v6.0
- VectorVest ProTrader 7
- VectorVest RealTime Derby Tool
- VectorVest Simulator
- VectorVest Variator
- VectorVest Watchdog